Scaling a Data-Driven Campaign for Omnichannel Customer Engagement
This project spanned two phases of a research-driven campaign. The initial report established the visual system, which was later expanded and refined in a second report and supporting campaign assets.
Role: Designer
Scope: Report design, infographic, webinar presentation, social assets, program branding
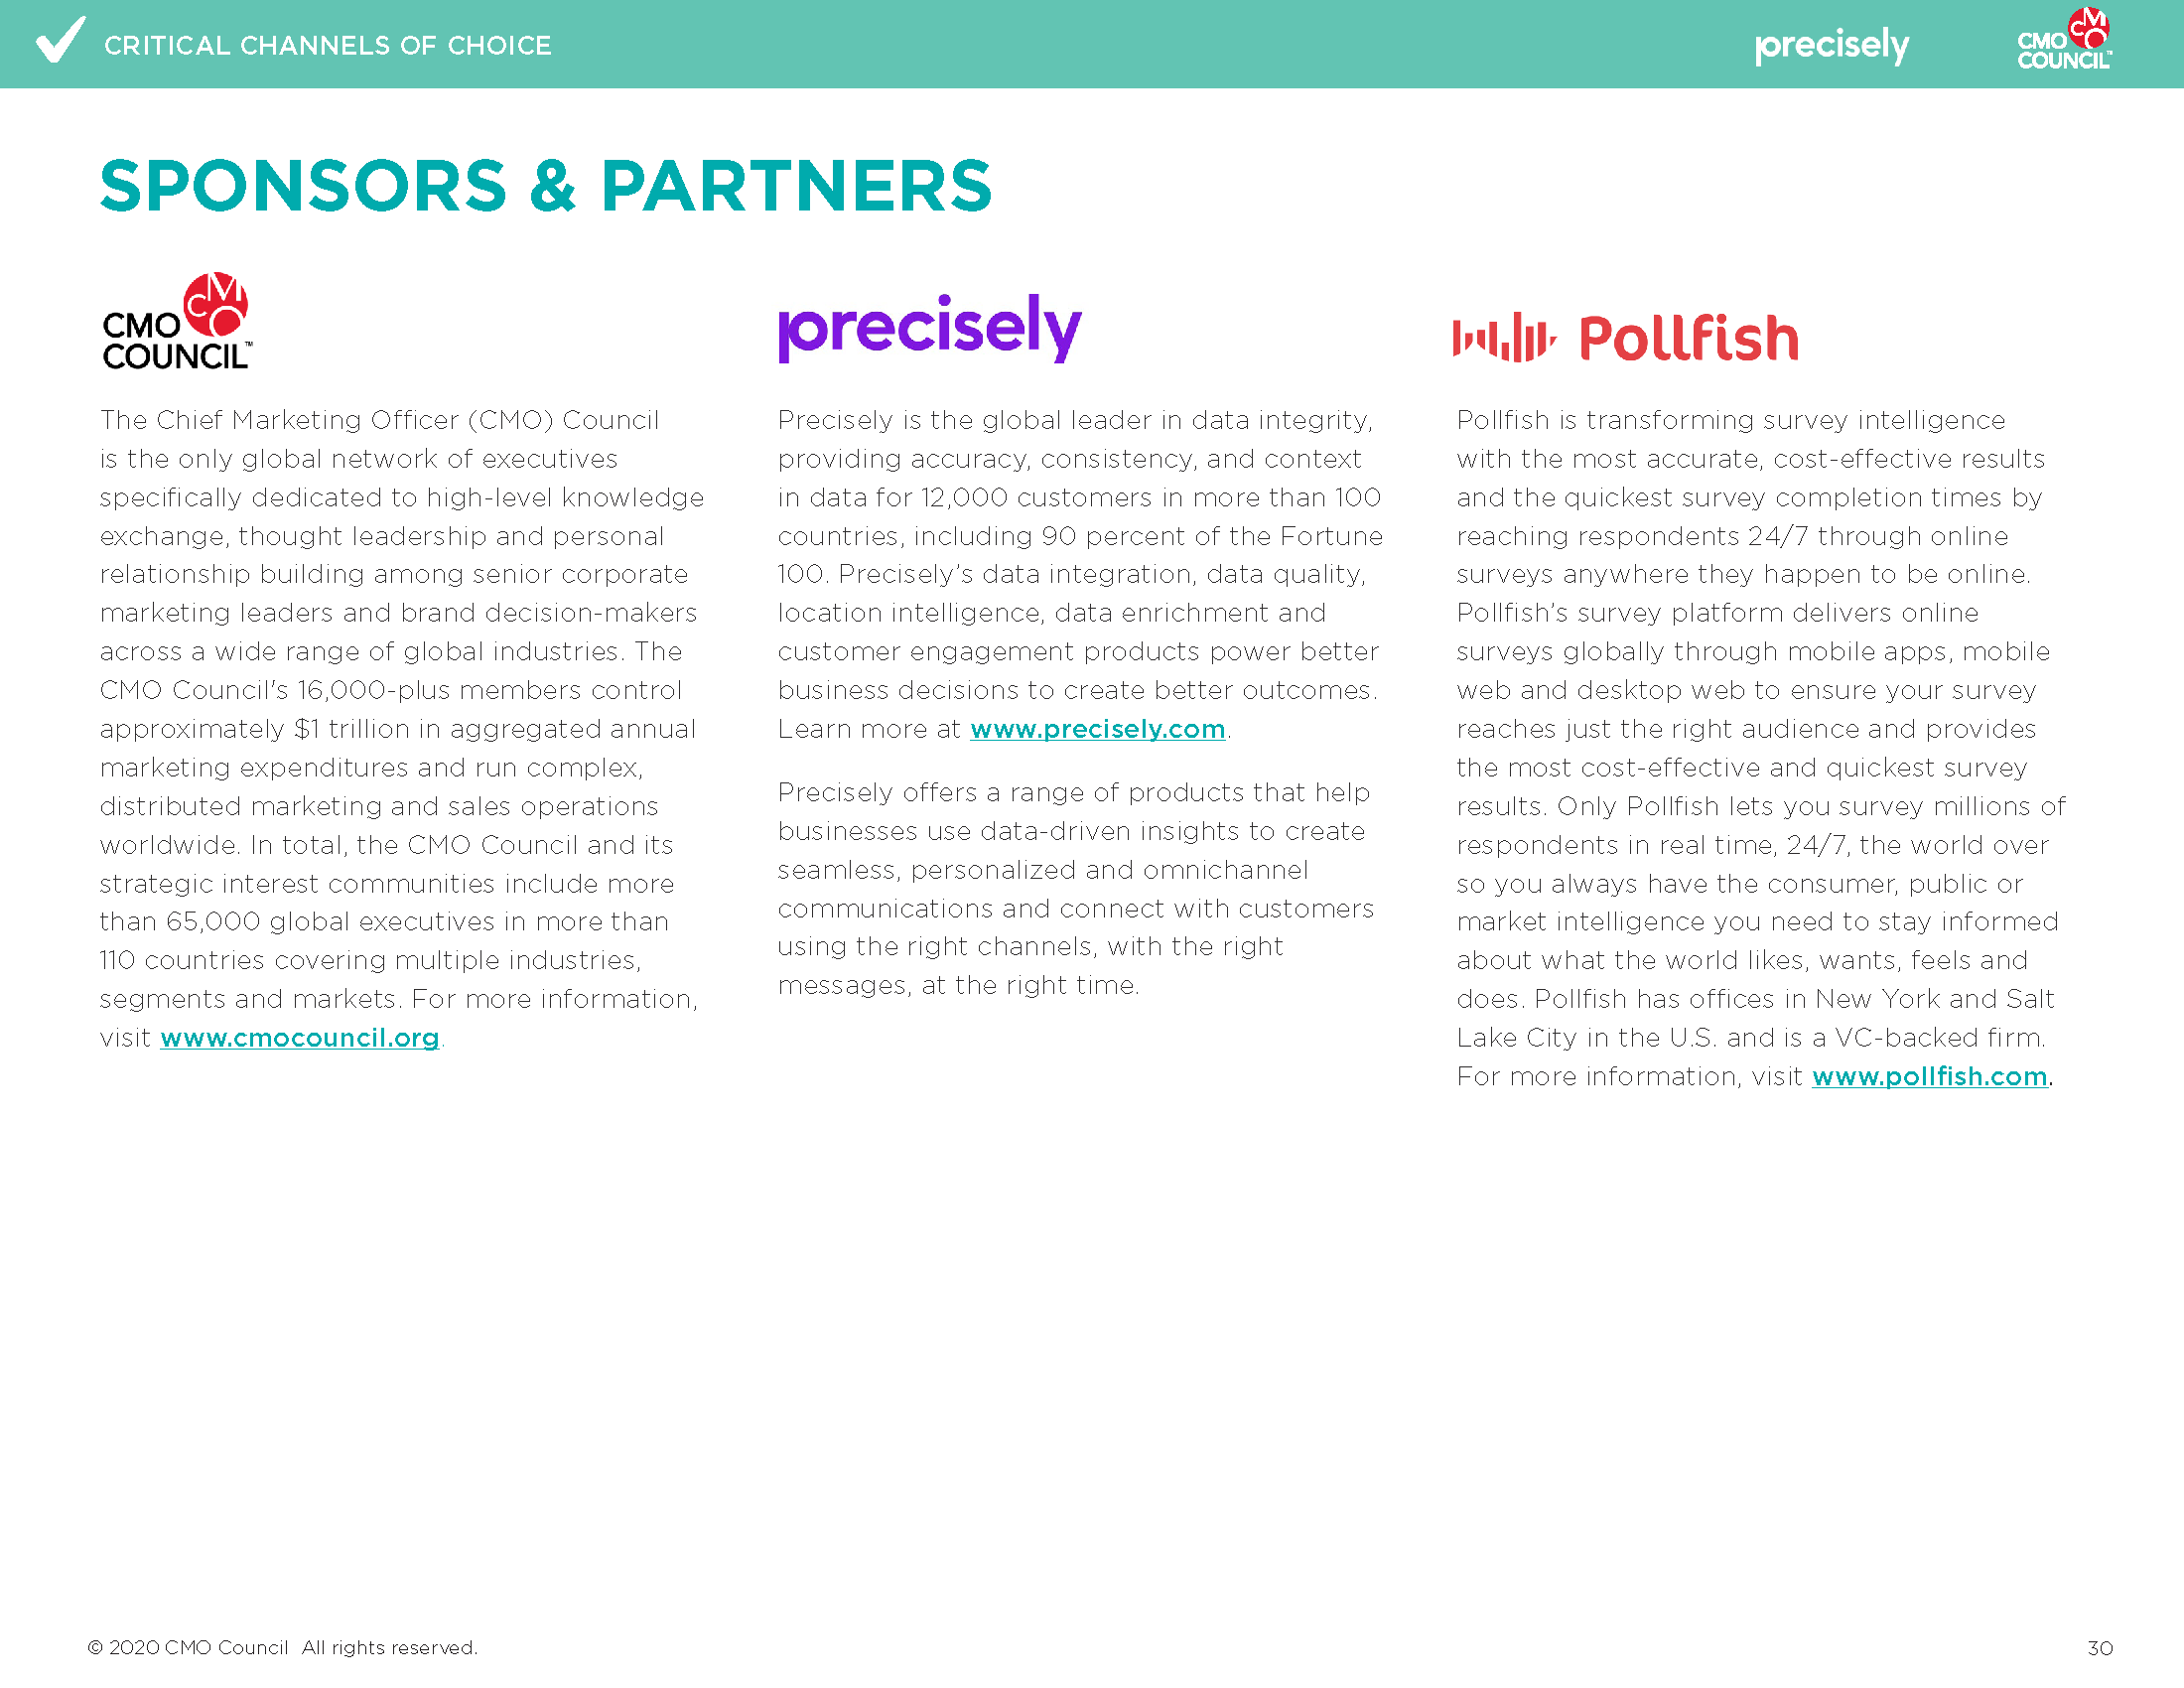
Sponsors:
-
Following the success of the initial report, the second phase needed to:
Extend the visual system while keeping consistency with the original campaign
Present new research findings in a way that felt fresh but cohesive
Support multiple formats, including long-form content, webinars, and social media
Create a unified campaign identity that could scale across deliverables
-
I approached this as an evolving design system, ensuring the second report and campaign assets felt like a natural extension of the original while introducing enough variation to keep the content engaging.
Built on the existing visual framework to maintain continuity across the campaign
Introduced new layouts and visual treatments to differentiate the second report
Designed a program logo to unify all campaign assets under a recognizable identity
Created flexible components that could adapt across report, infographic, and presentation formats
-
The second phase focused on expanding the campaign into a fully integrated content ecosystem.
Program Branding
Created a program logo to unify the campaign across all assets
Applied branding consistently across reports, presentations, and digital content
Report
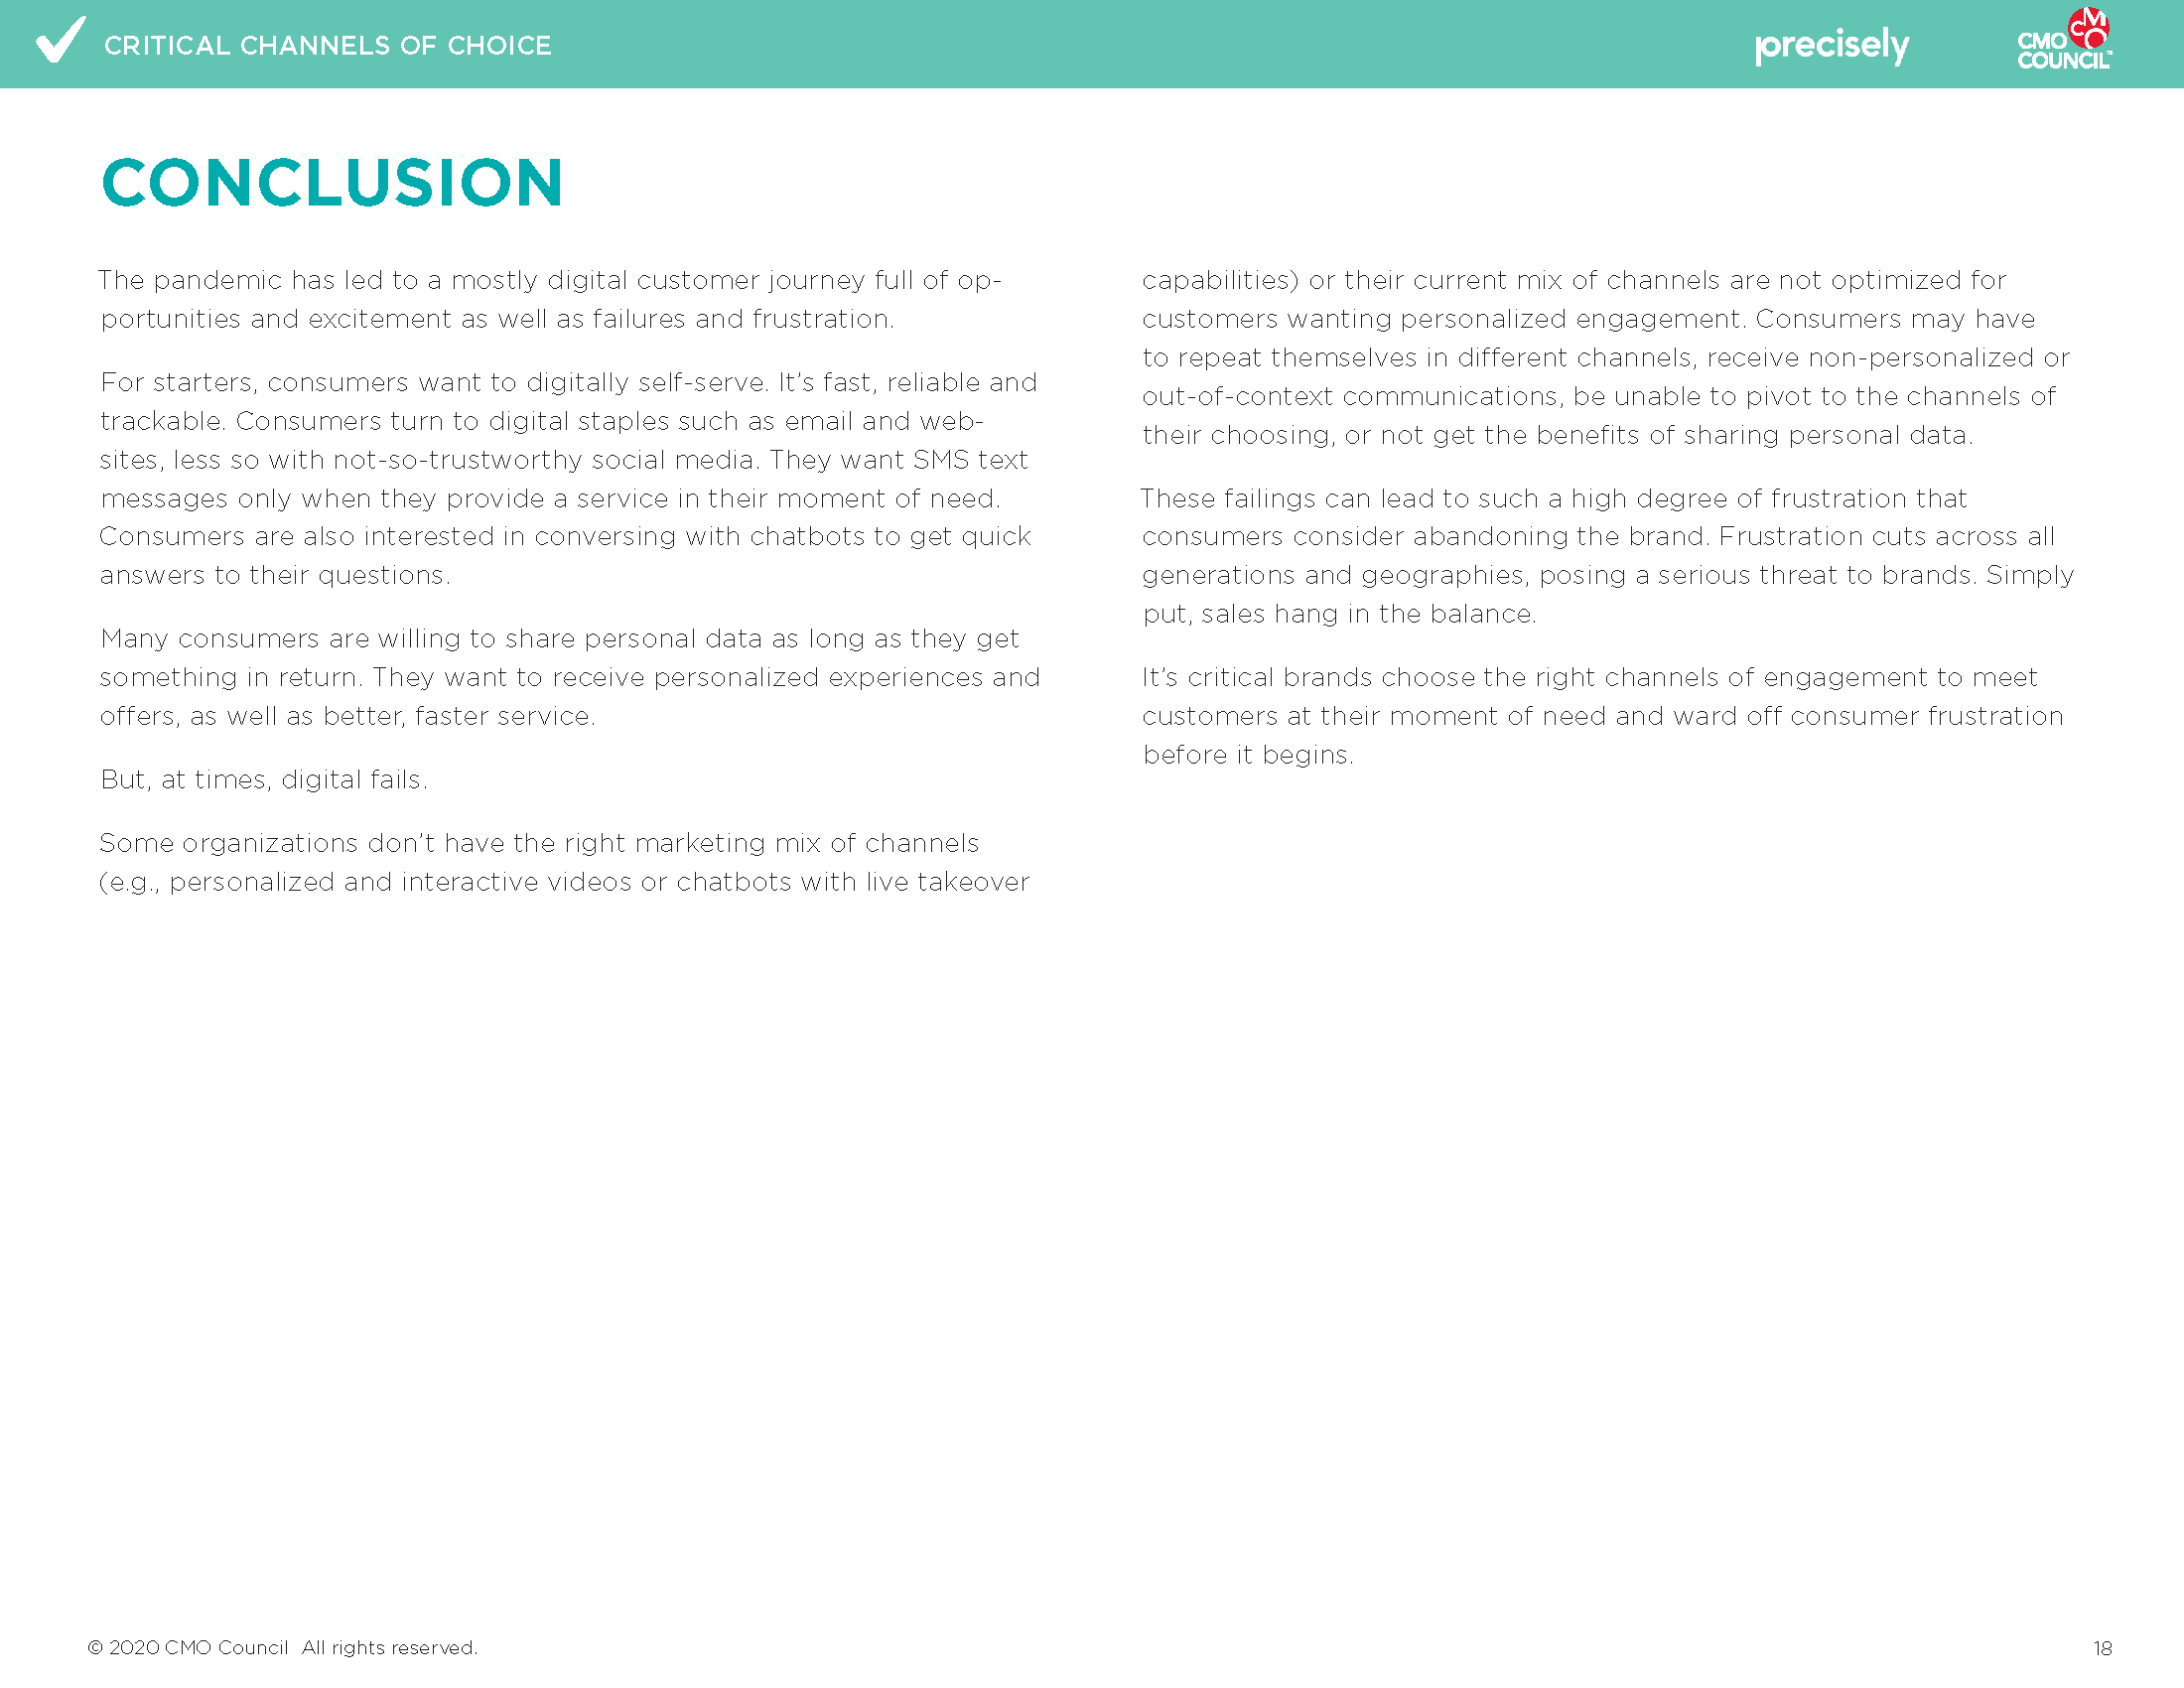
Designed the follow-up report with updated layouts and refined visual hierarchy
Balanced continuity with the original report while introducing new visual variation
Structured content to clearly communicate updated research insights
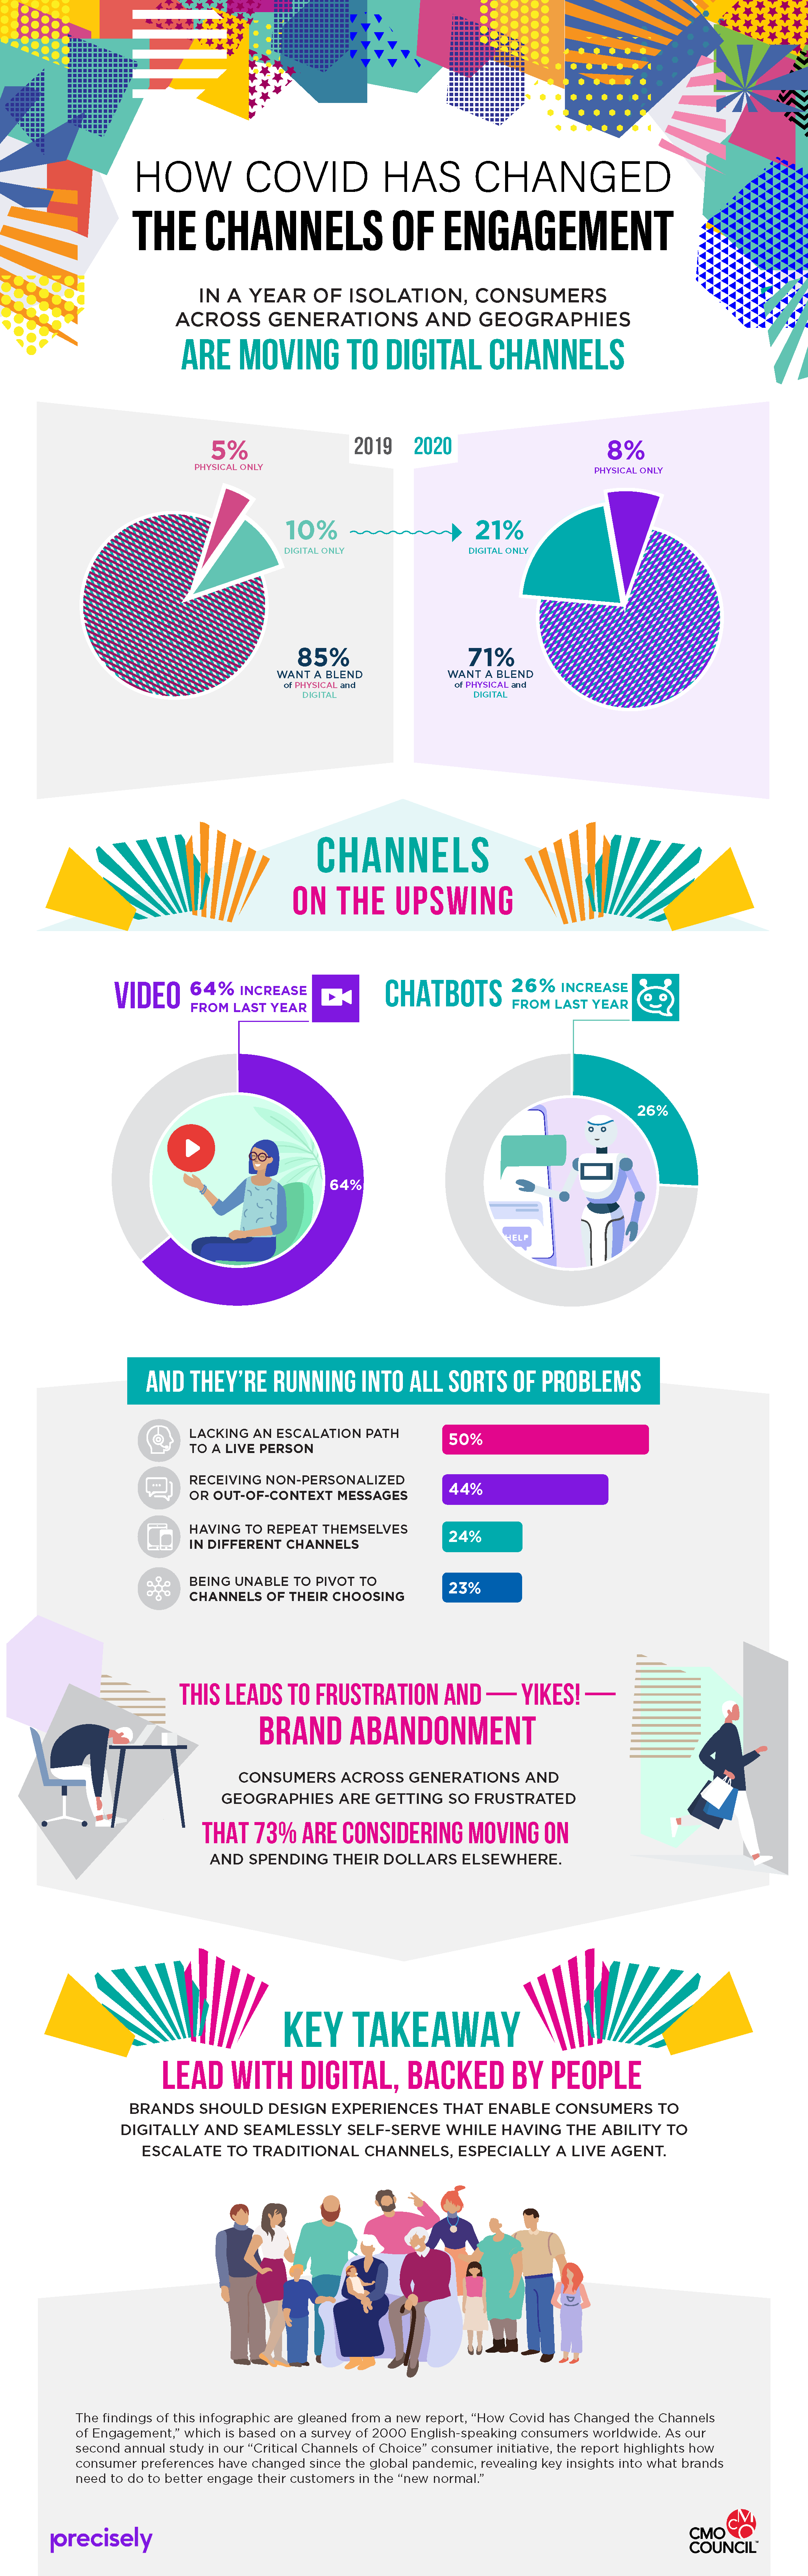
Infographic
Translated key findings from the report into a concise, high-impact format
Prioritized clarity and scannability for quick consumption
Maintained alignment with the overall campaign visual system
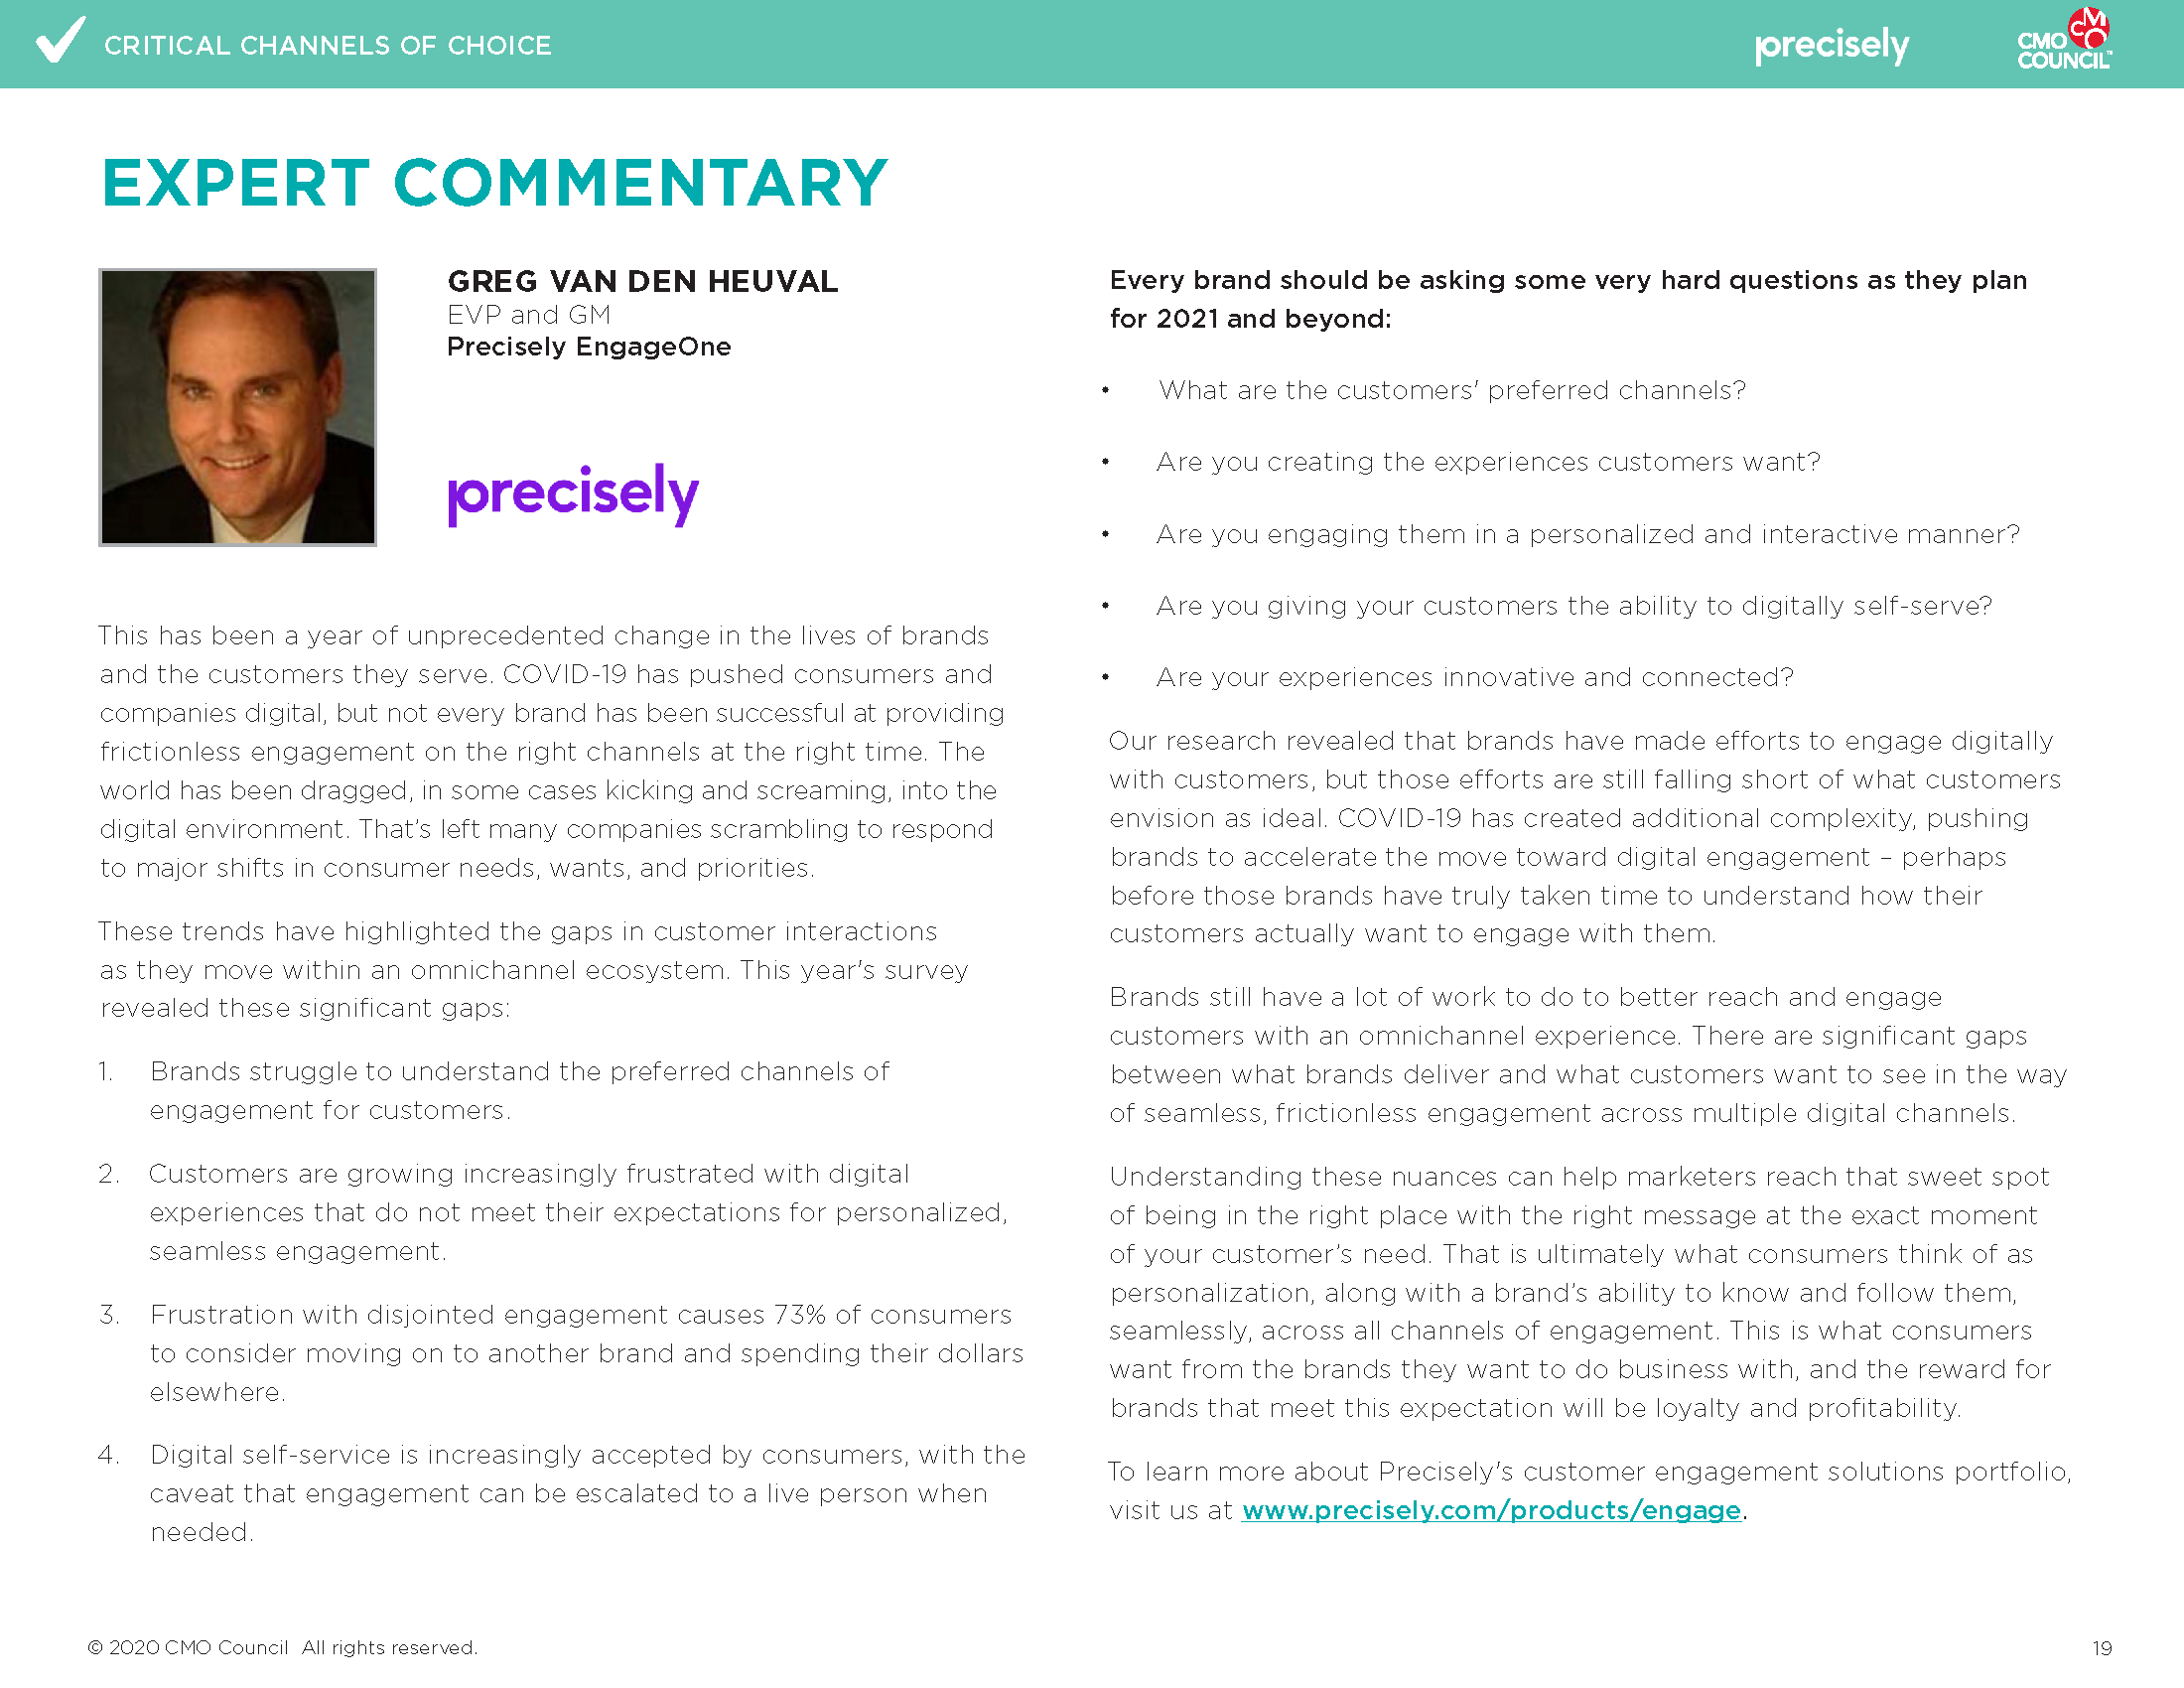
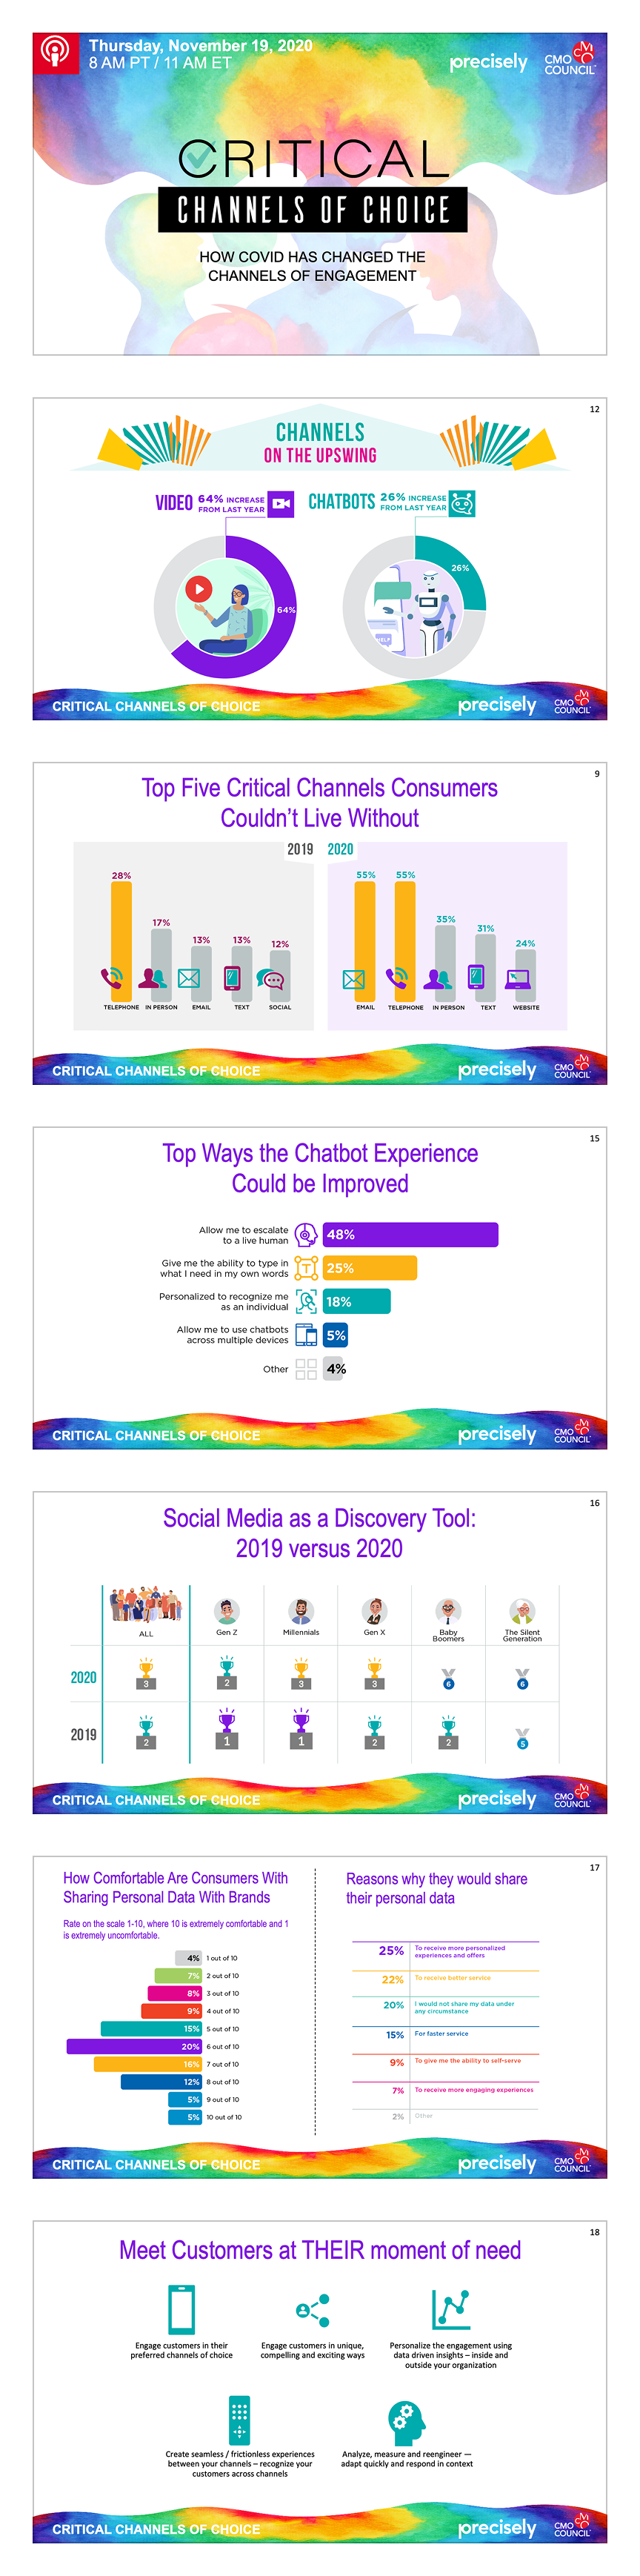
Webinar & Presentation Assets
Designed presentation slides to support webinar storytelling and data delivery
Created supporting visuals to reinforce key insights during live presentations
Ensured consistency between report content and presentation materials
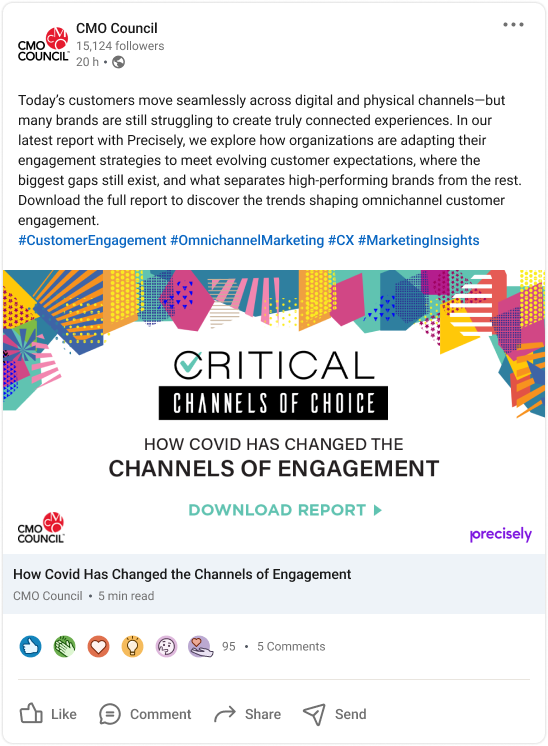
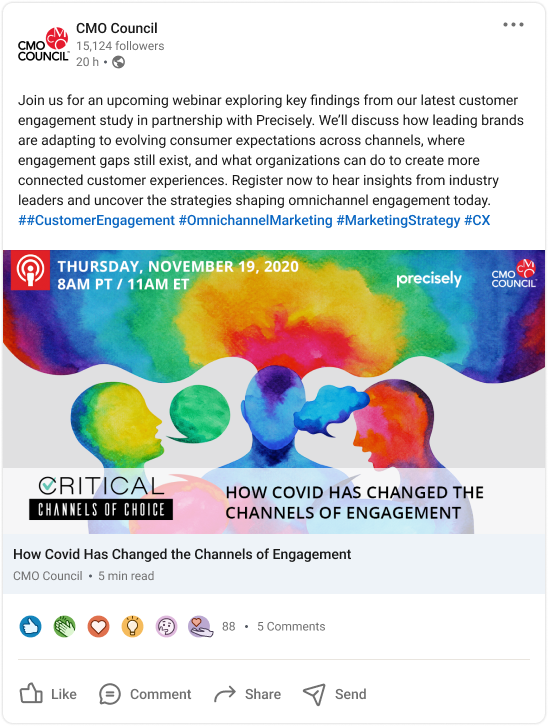
Social Media Assets
Developed social graphics to promote report findings and webinar engagement
Simplified complex insights into digestible, visually engaging formats
Maintained a consistent look and feel across campaign touchpoints
Phase 1: The Pitney Bowes Study
Campain Ecosystem
To unify both campaign phases, we created a program logo that carries through every deliverable — from the report and infographic to all supporting assets.
Defining the Visual Foundation
I established the initial visual system for the campaign — defining the layout structure, illustration, and data visualization styles that would set the tone for everything that followed. The goal was to develop a cohesive design language with enough flexibility to scale across future reports and campaign assets, while maintaining the clarity and consistency needed to make data-heavy content accessible and engaging.
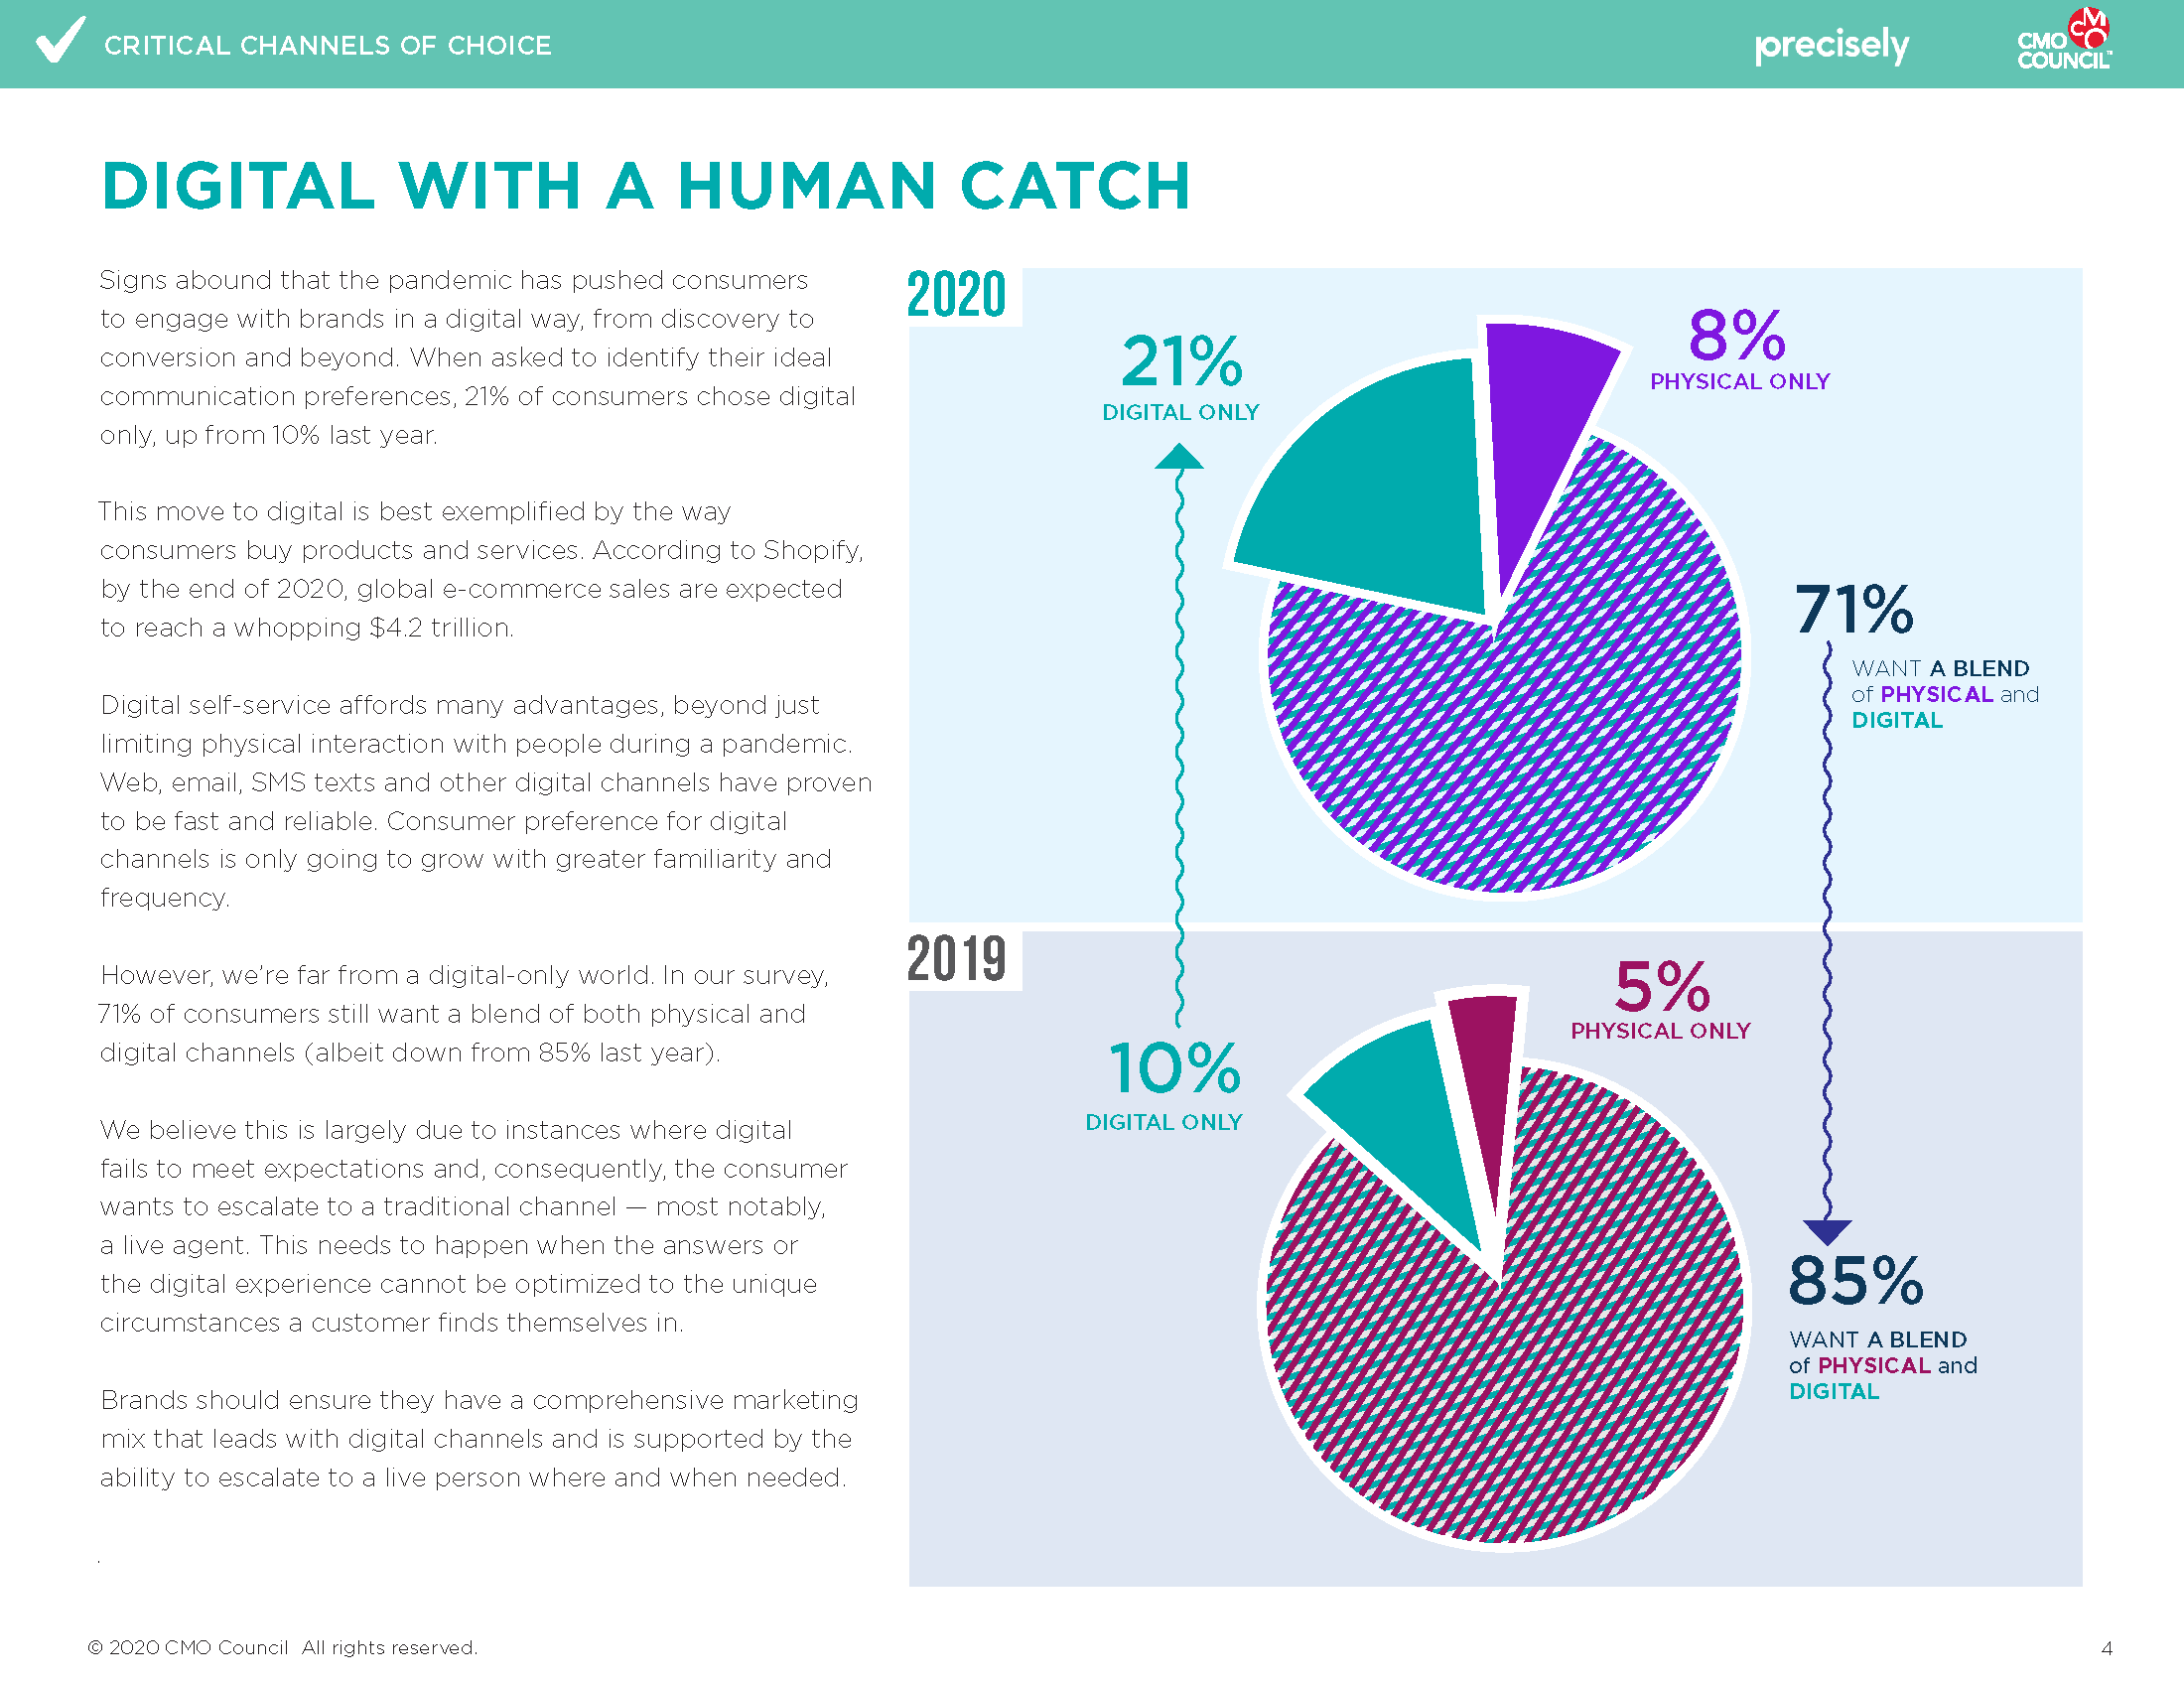
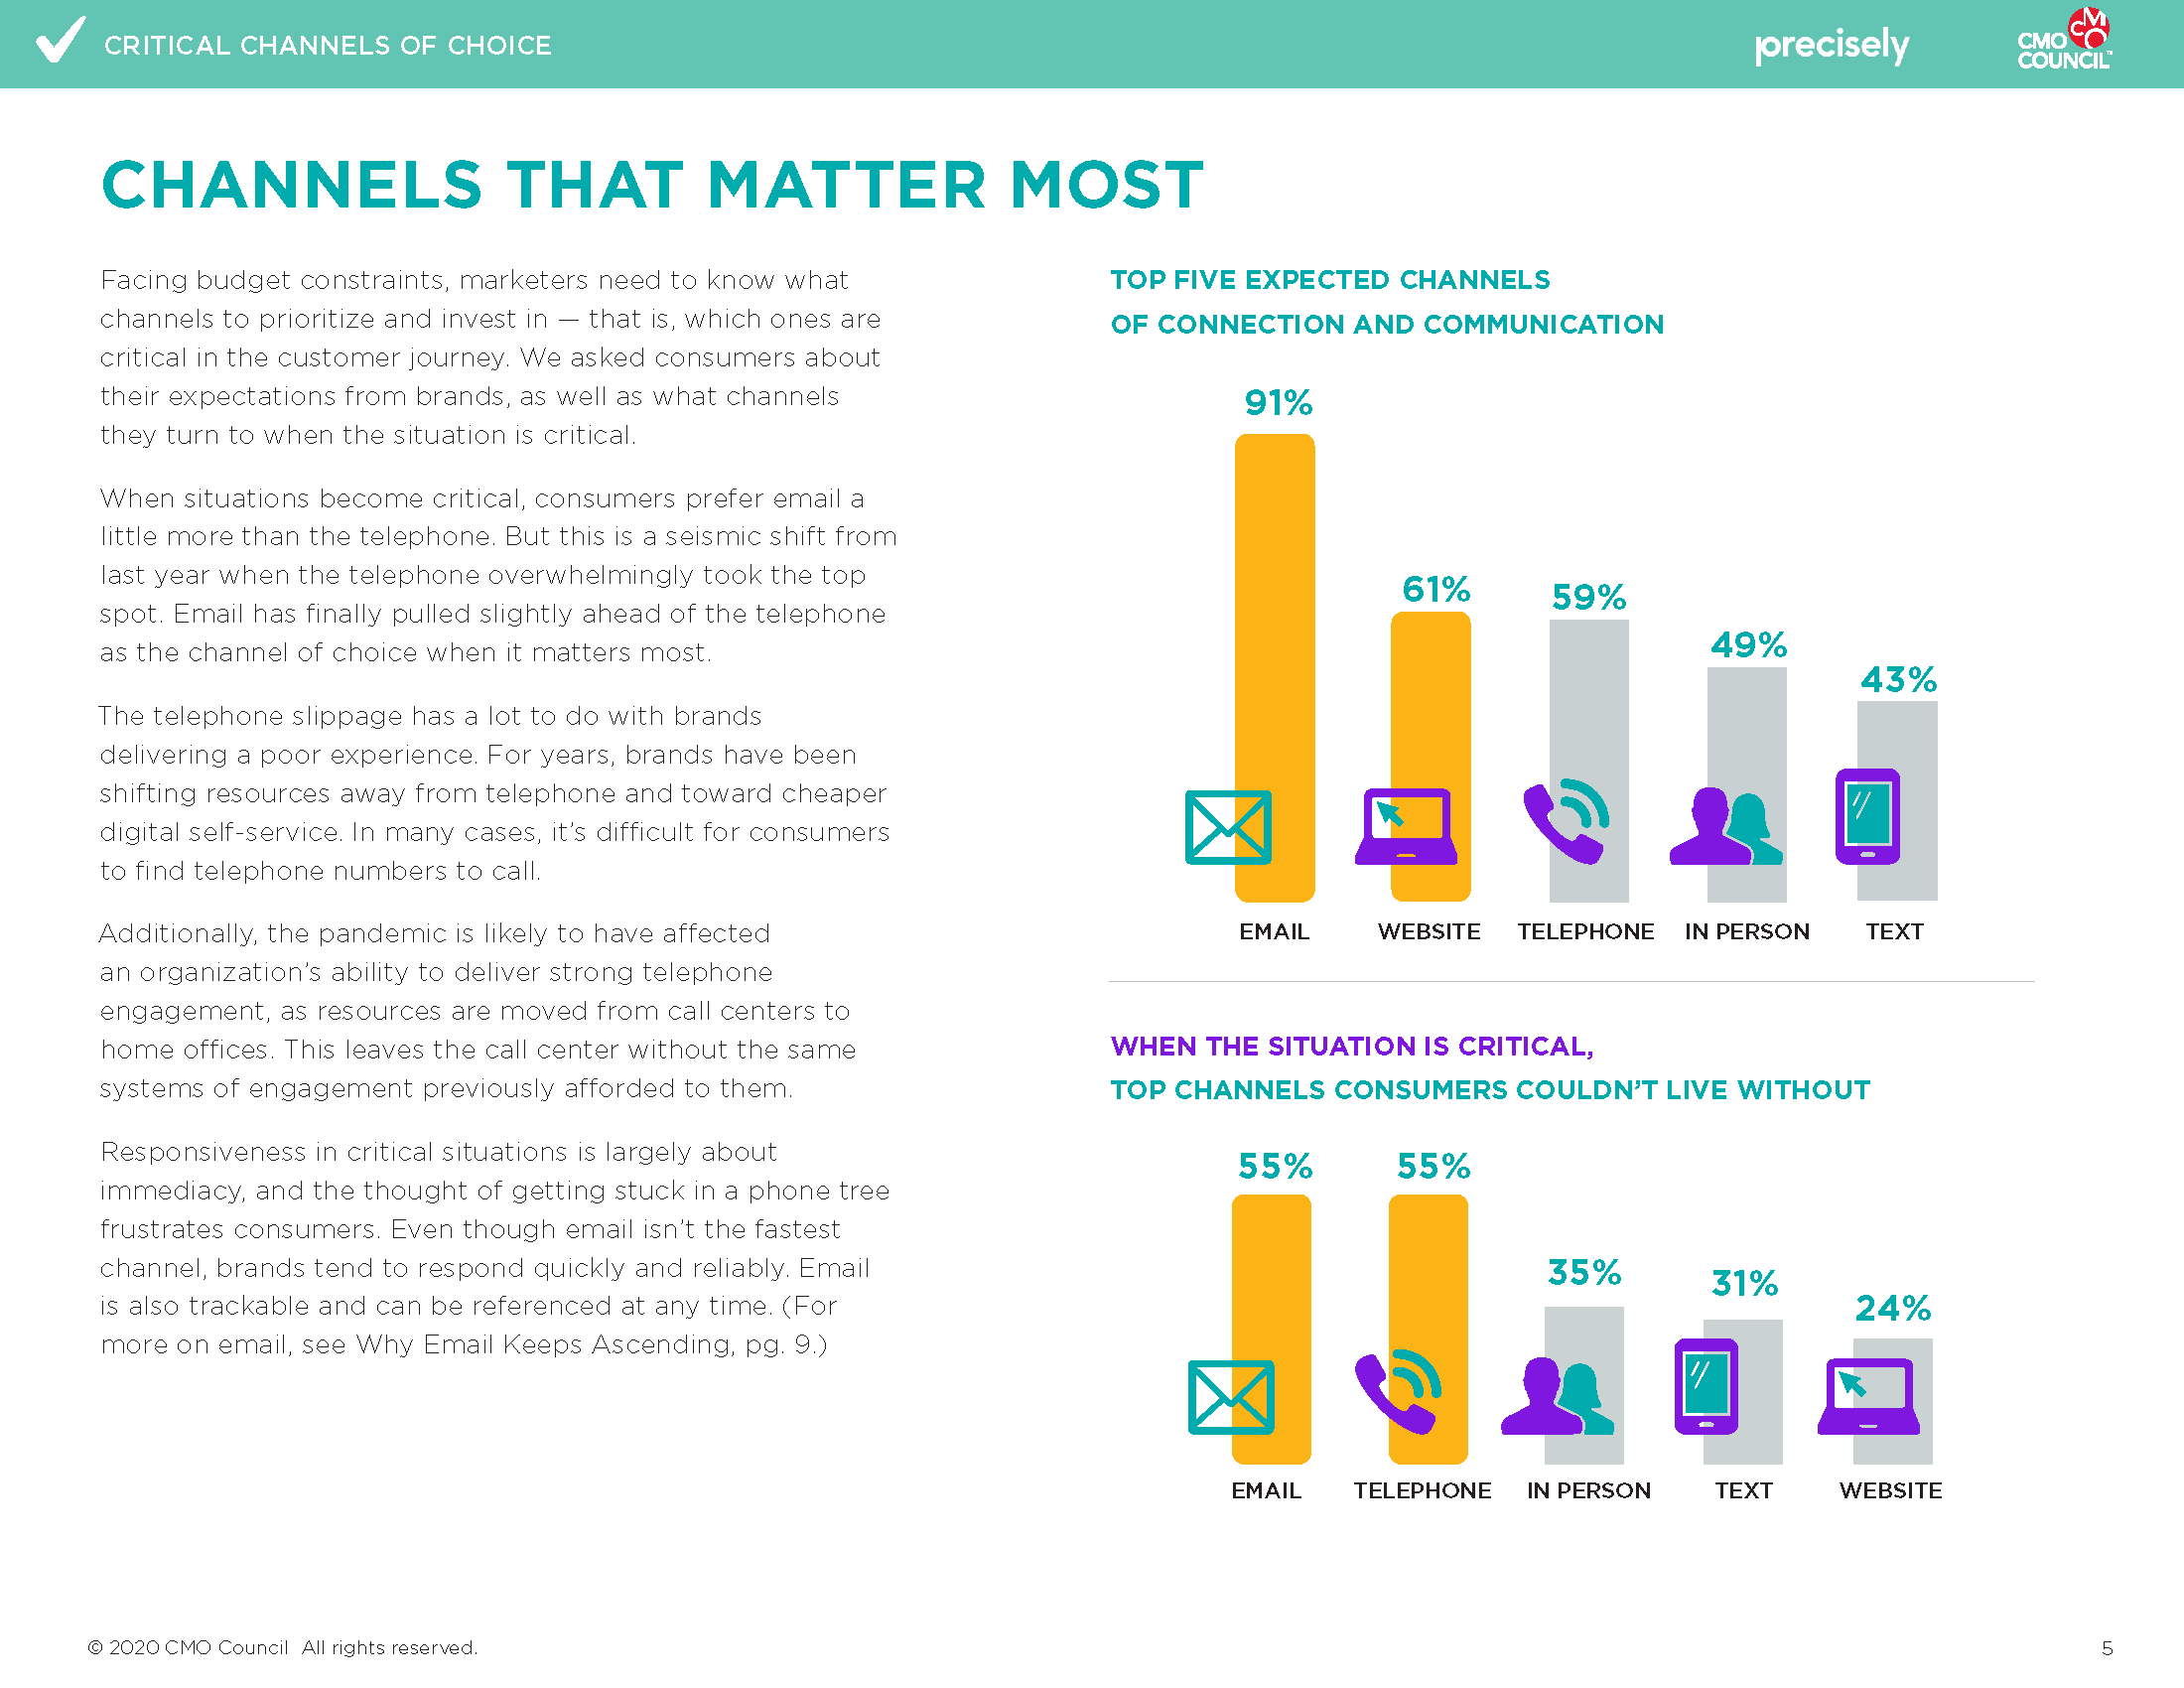
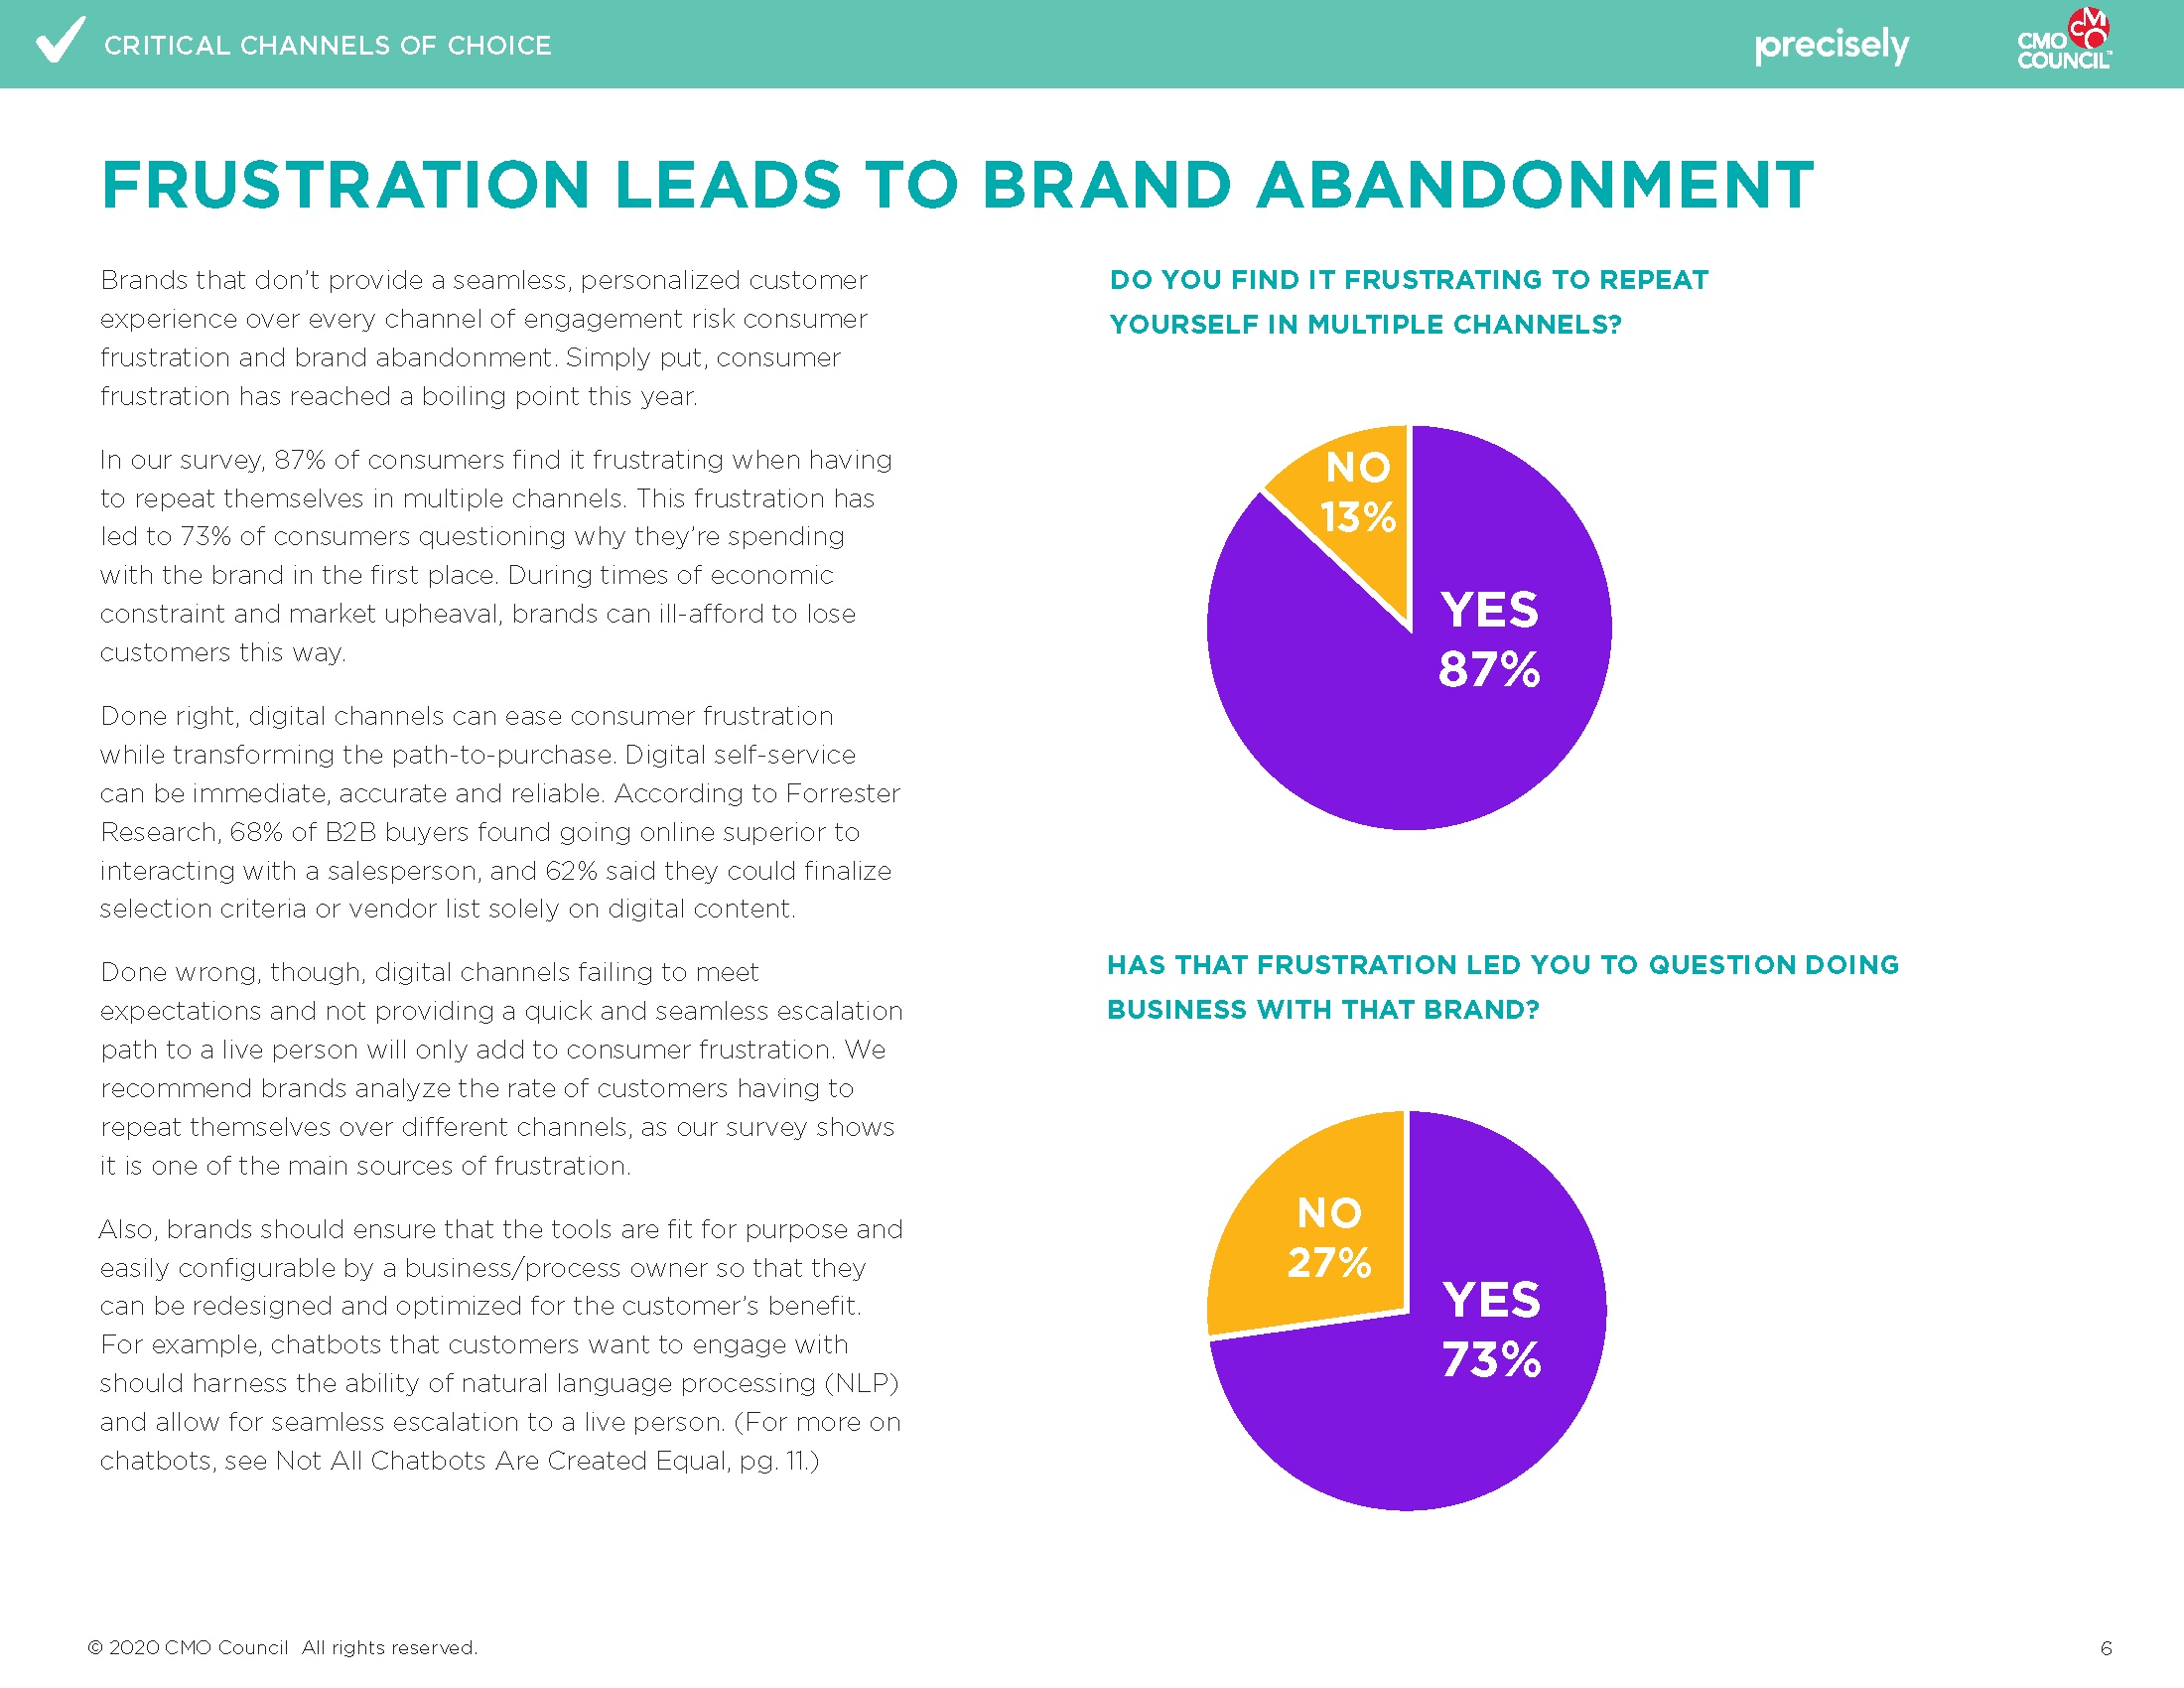
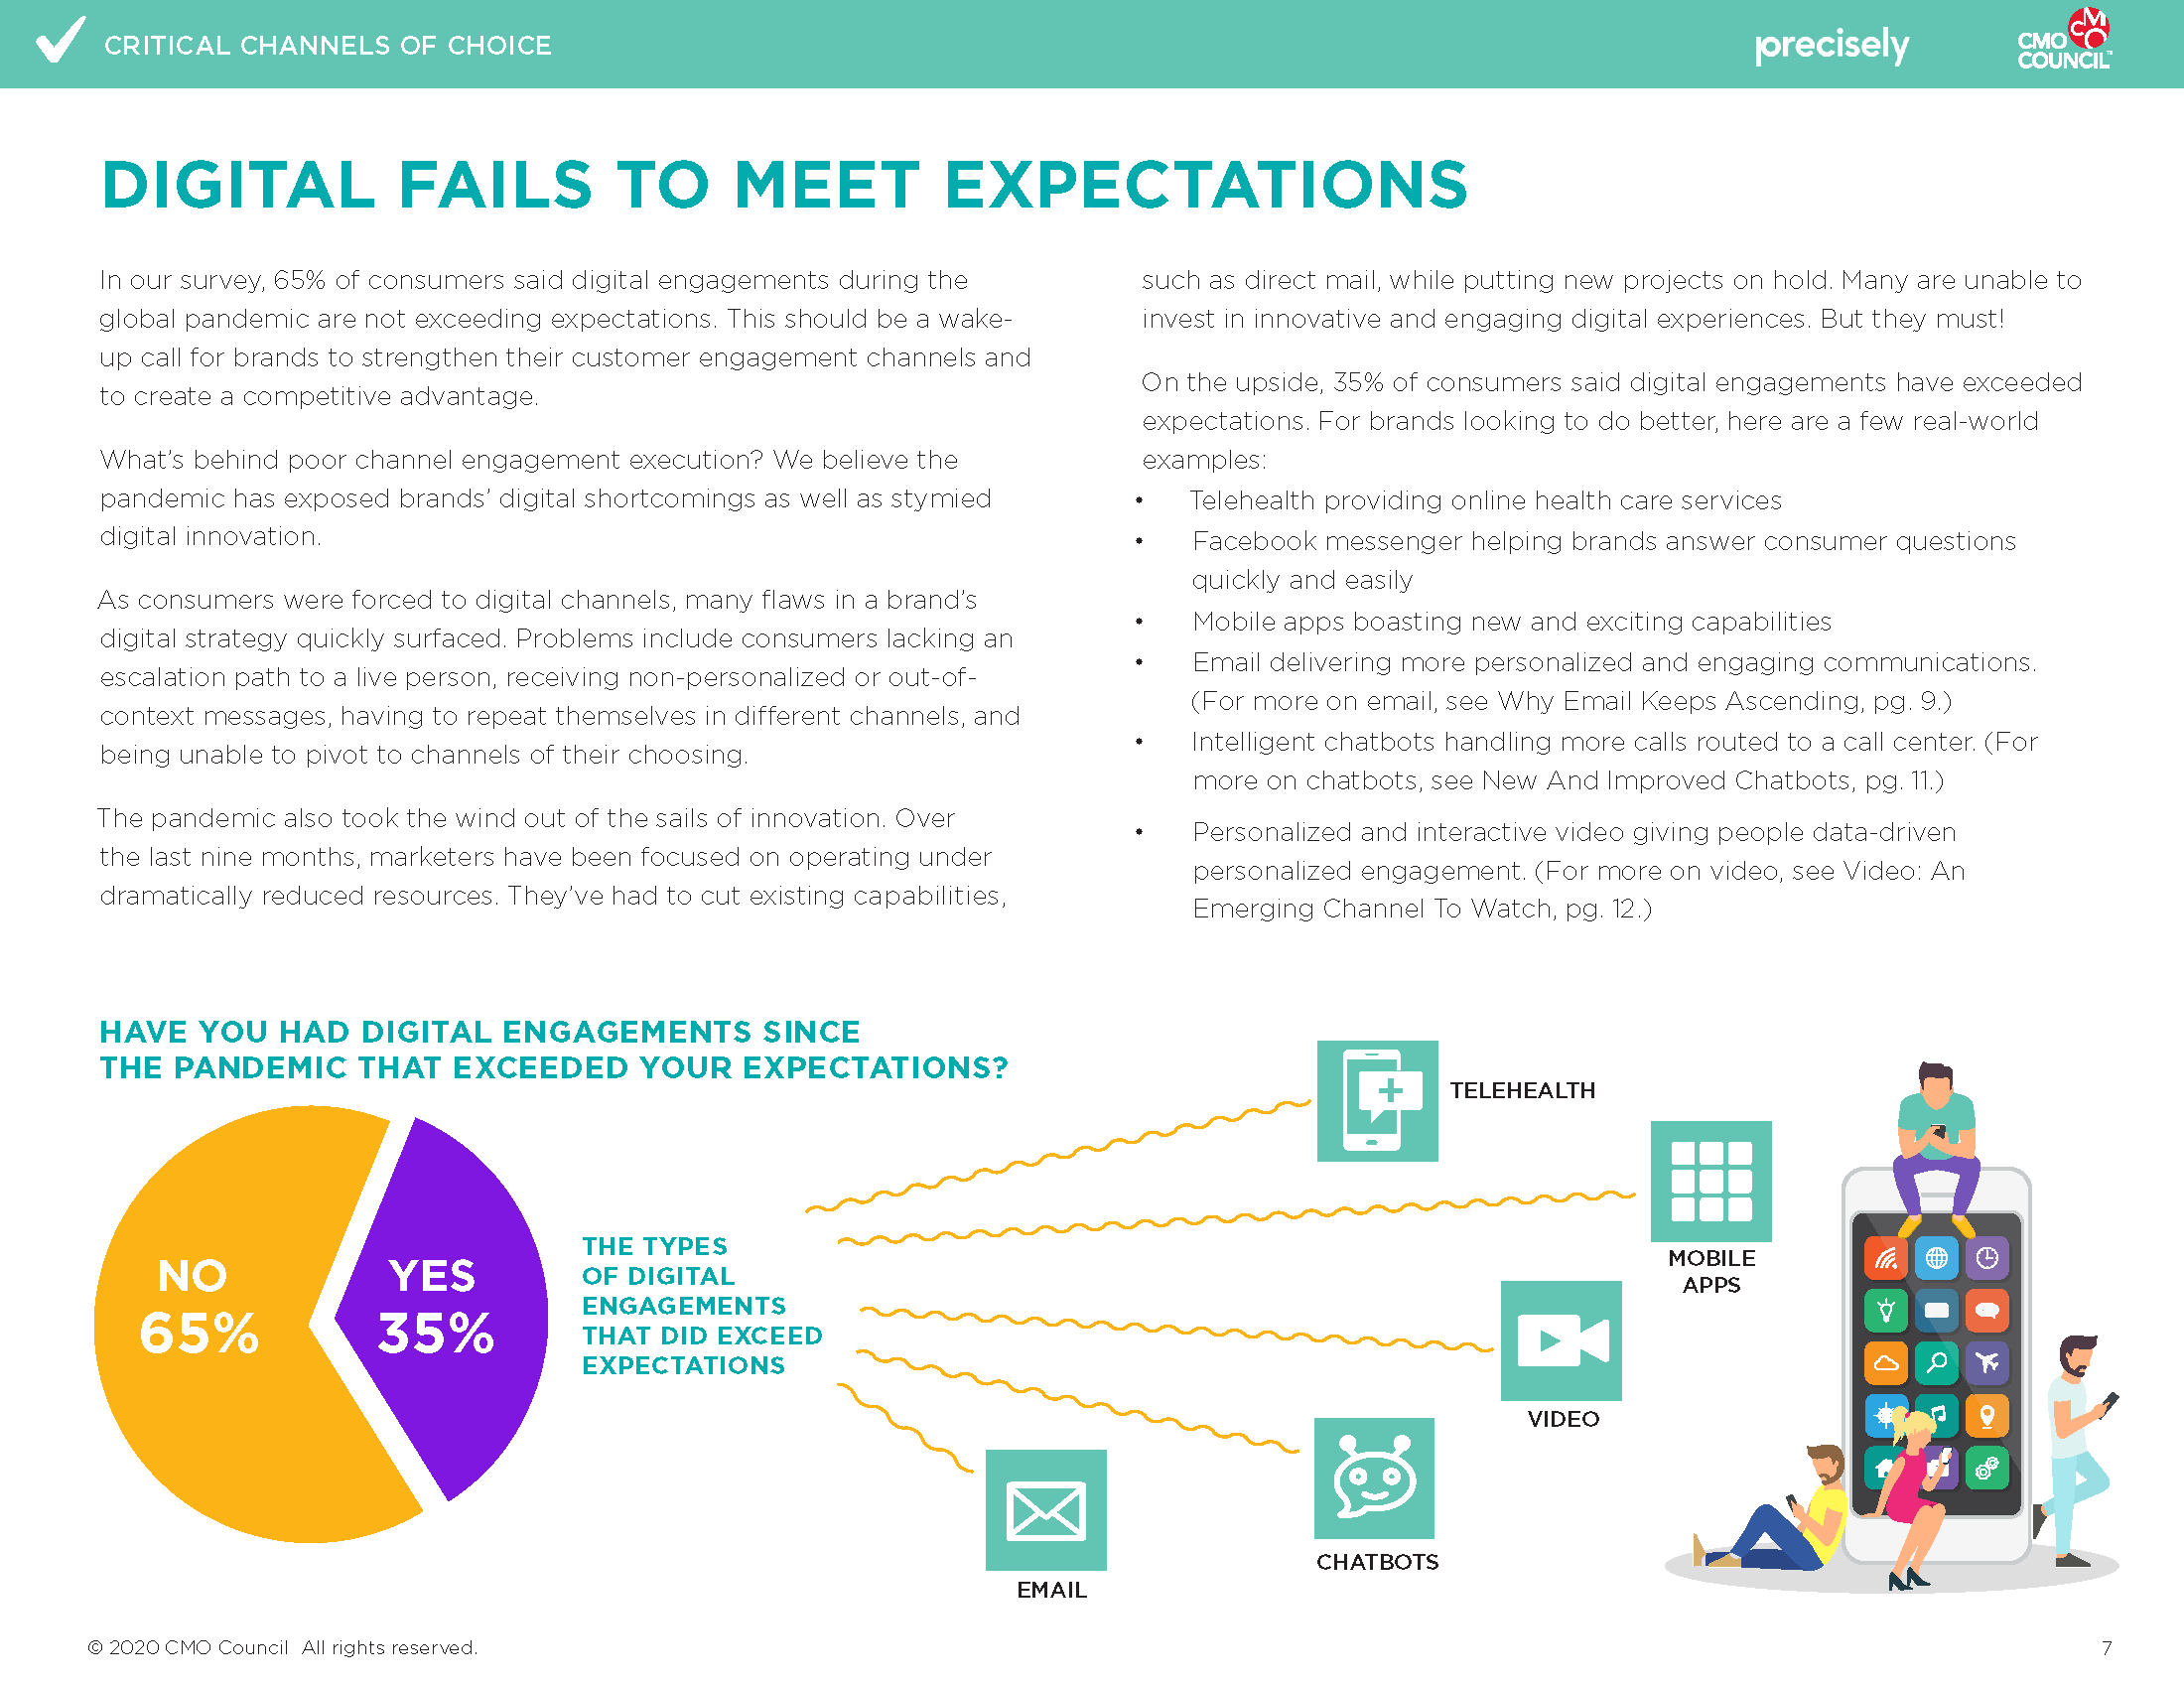
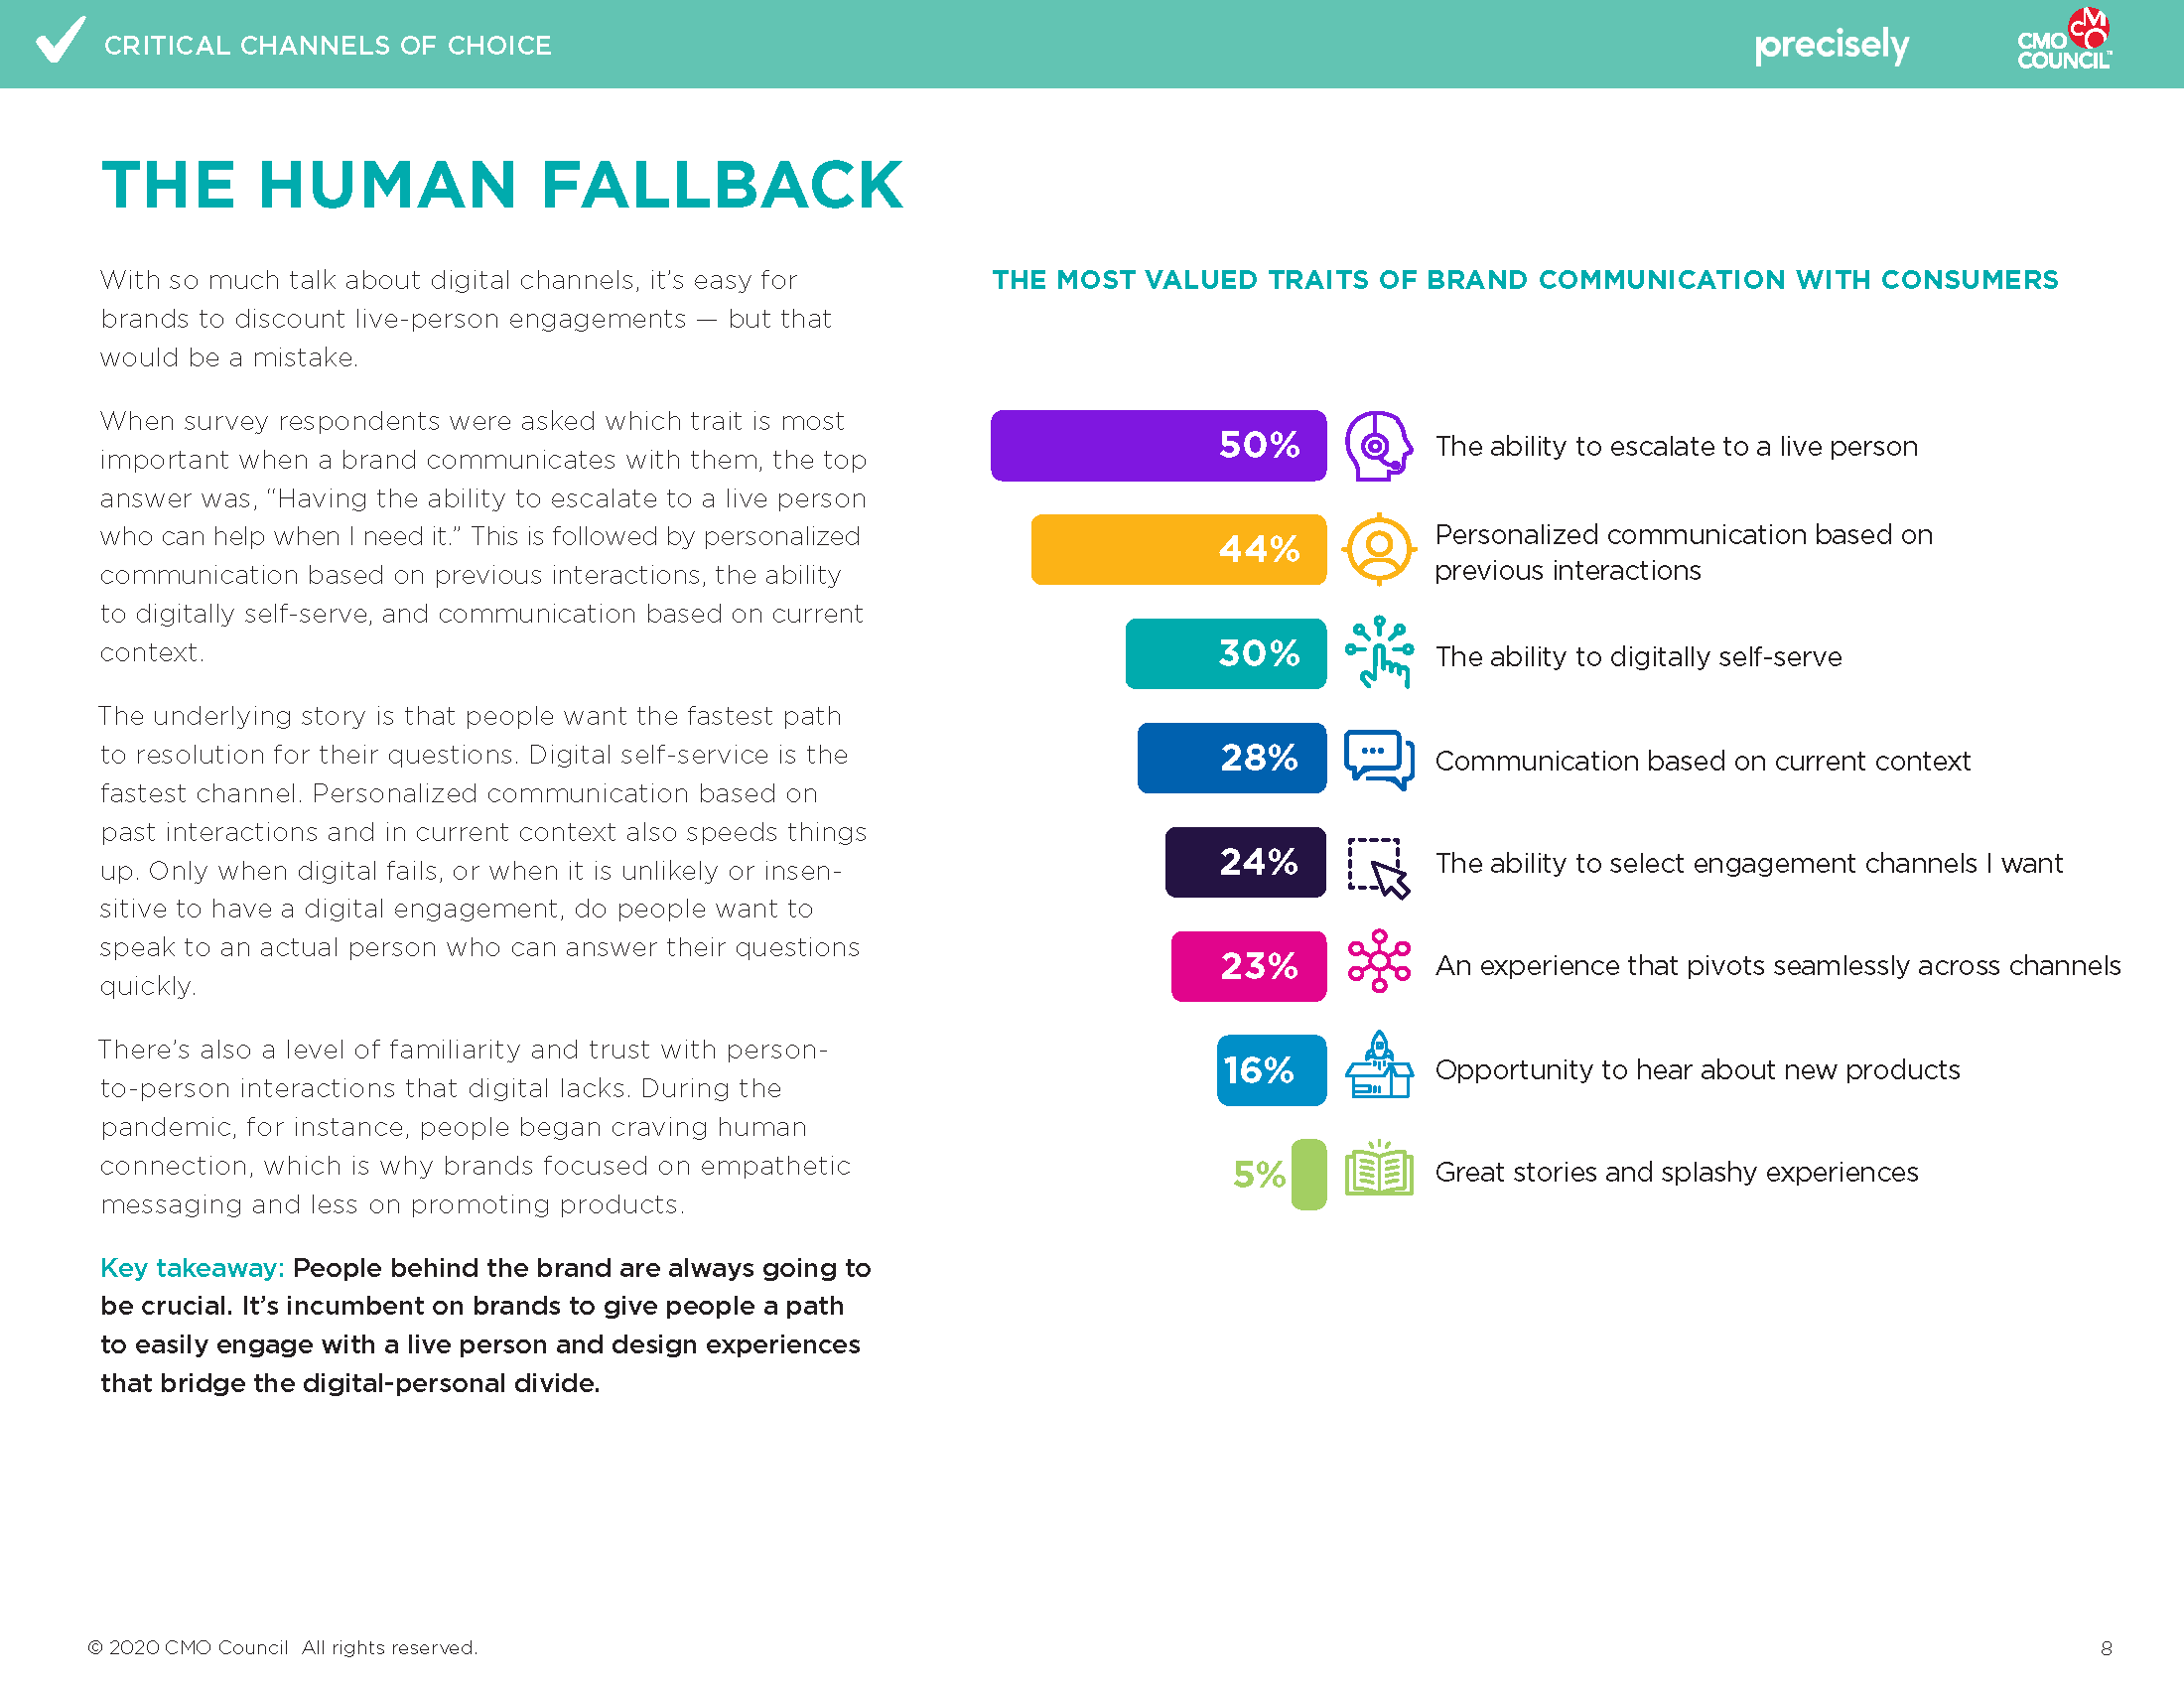
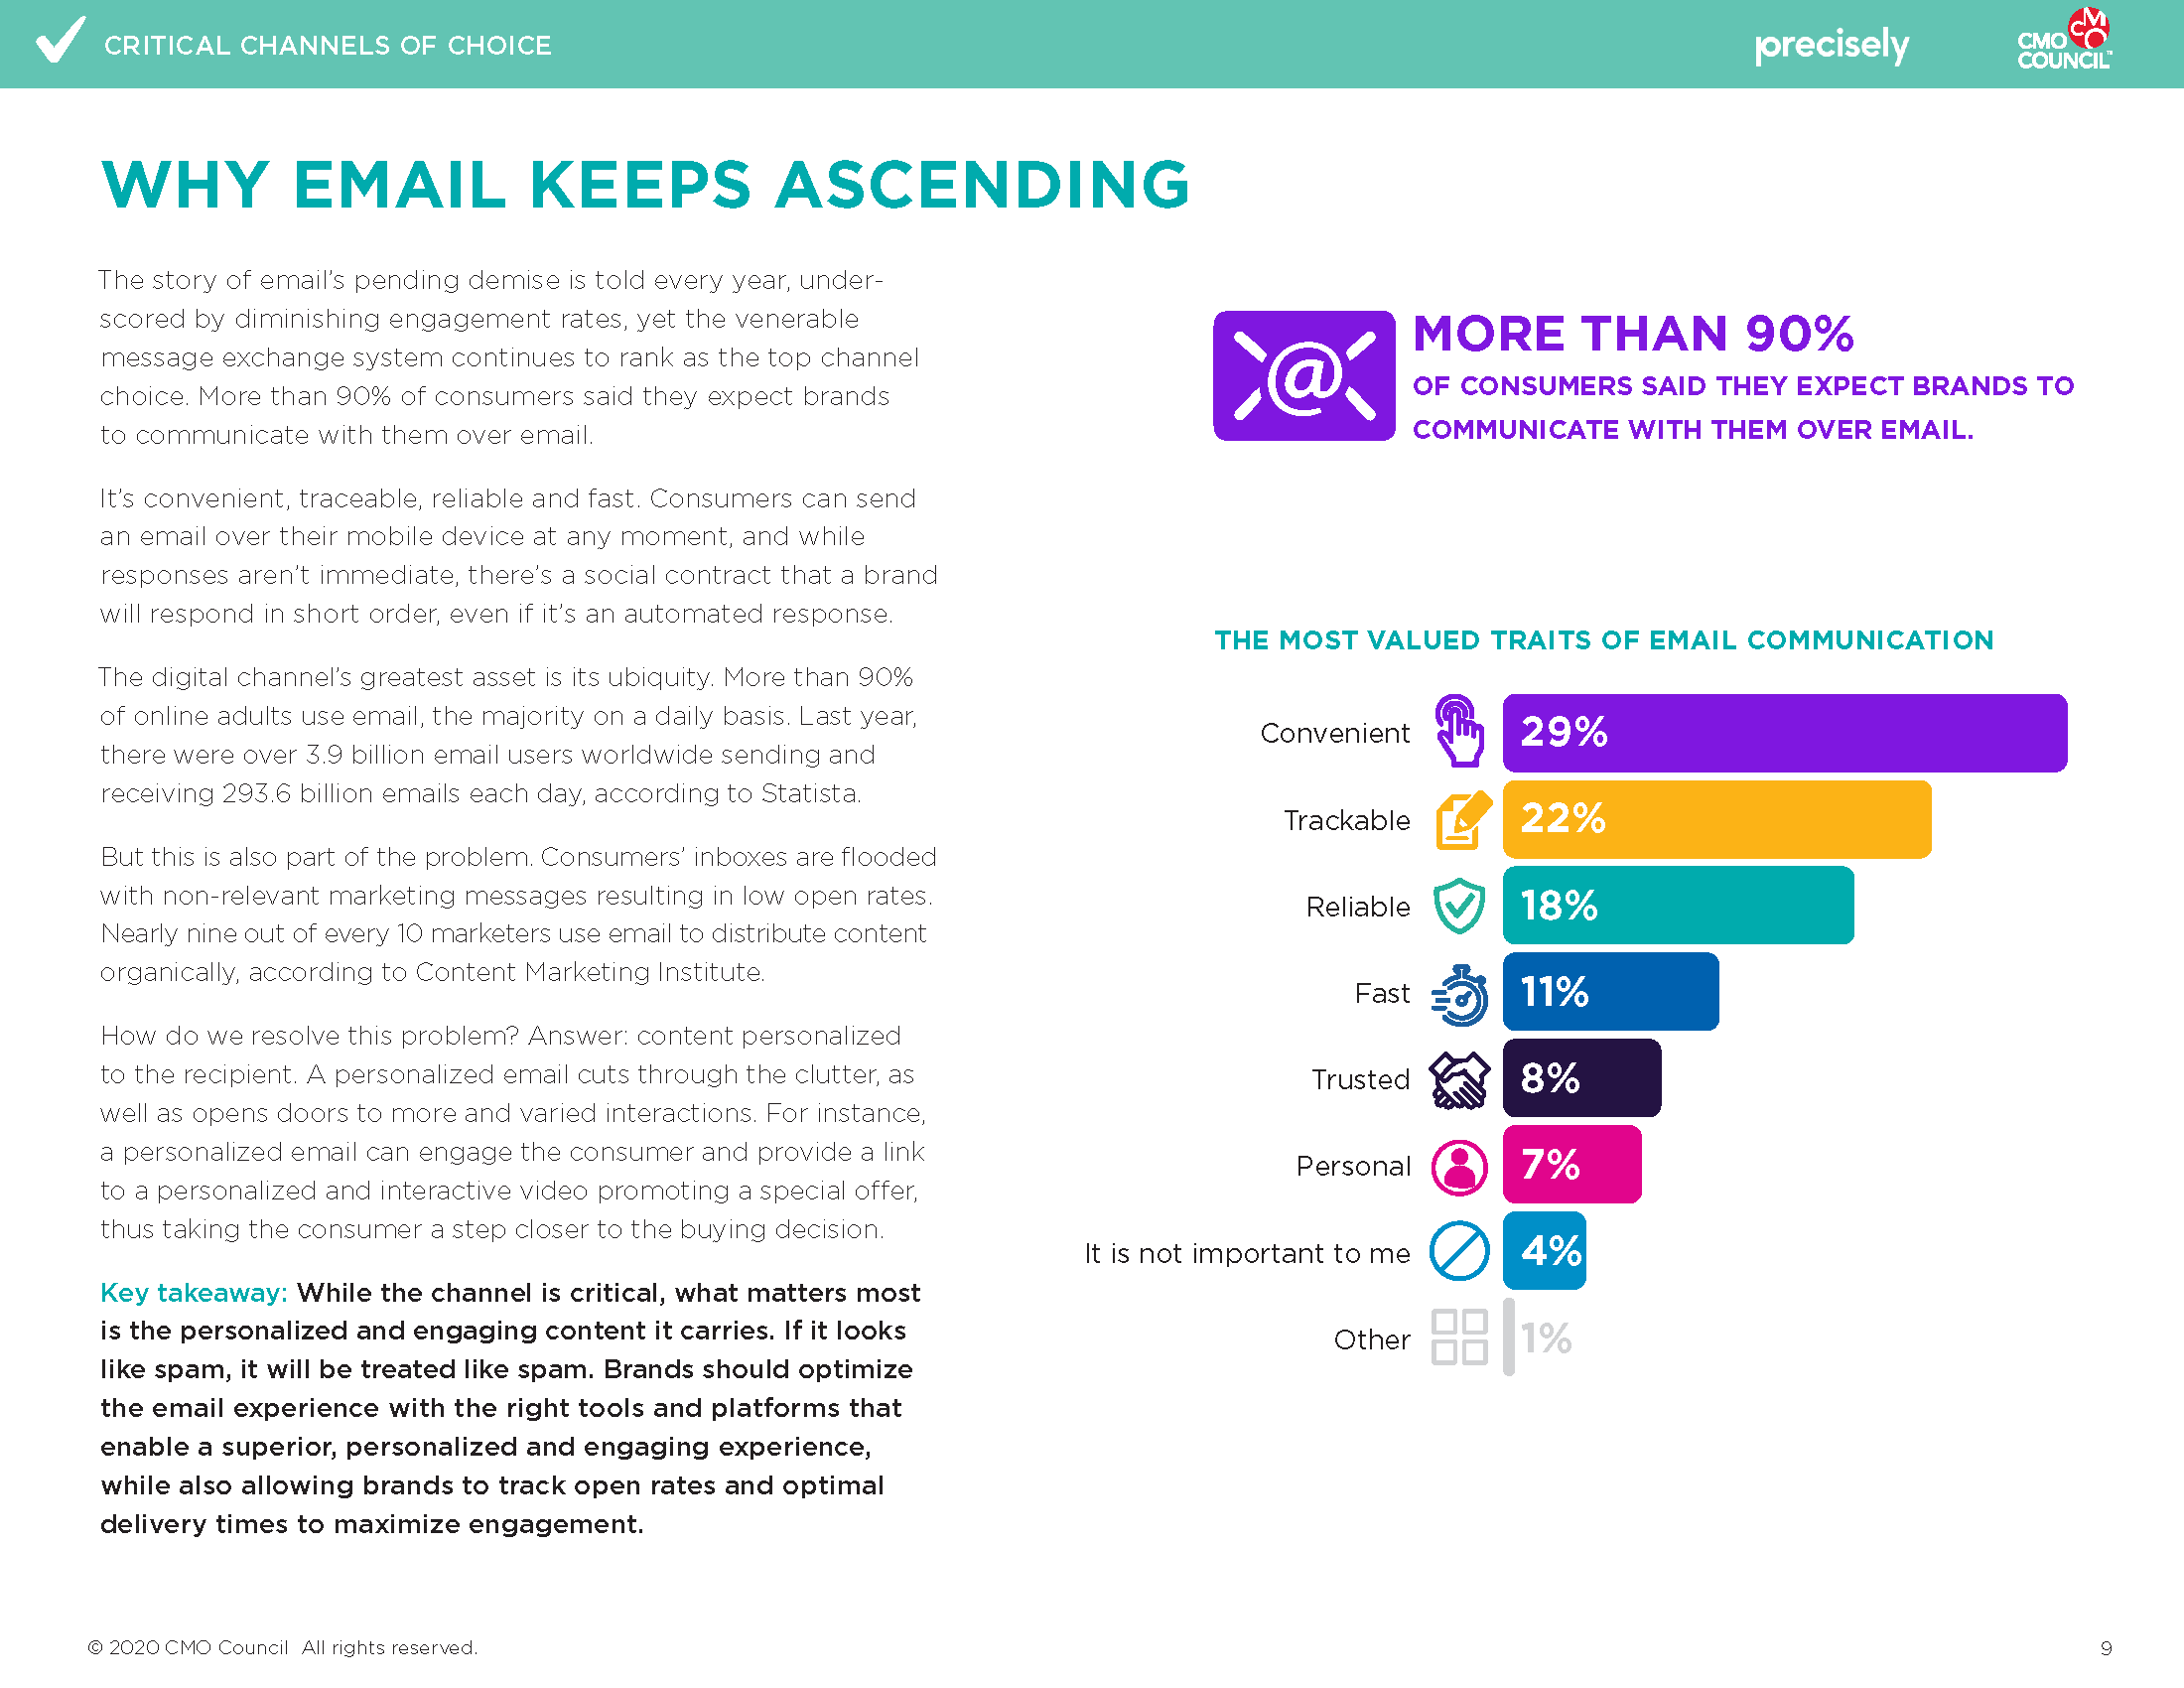
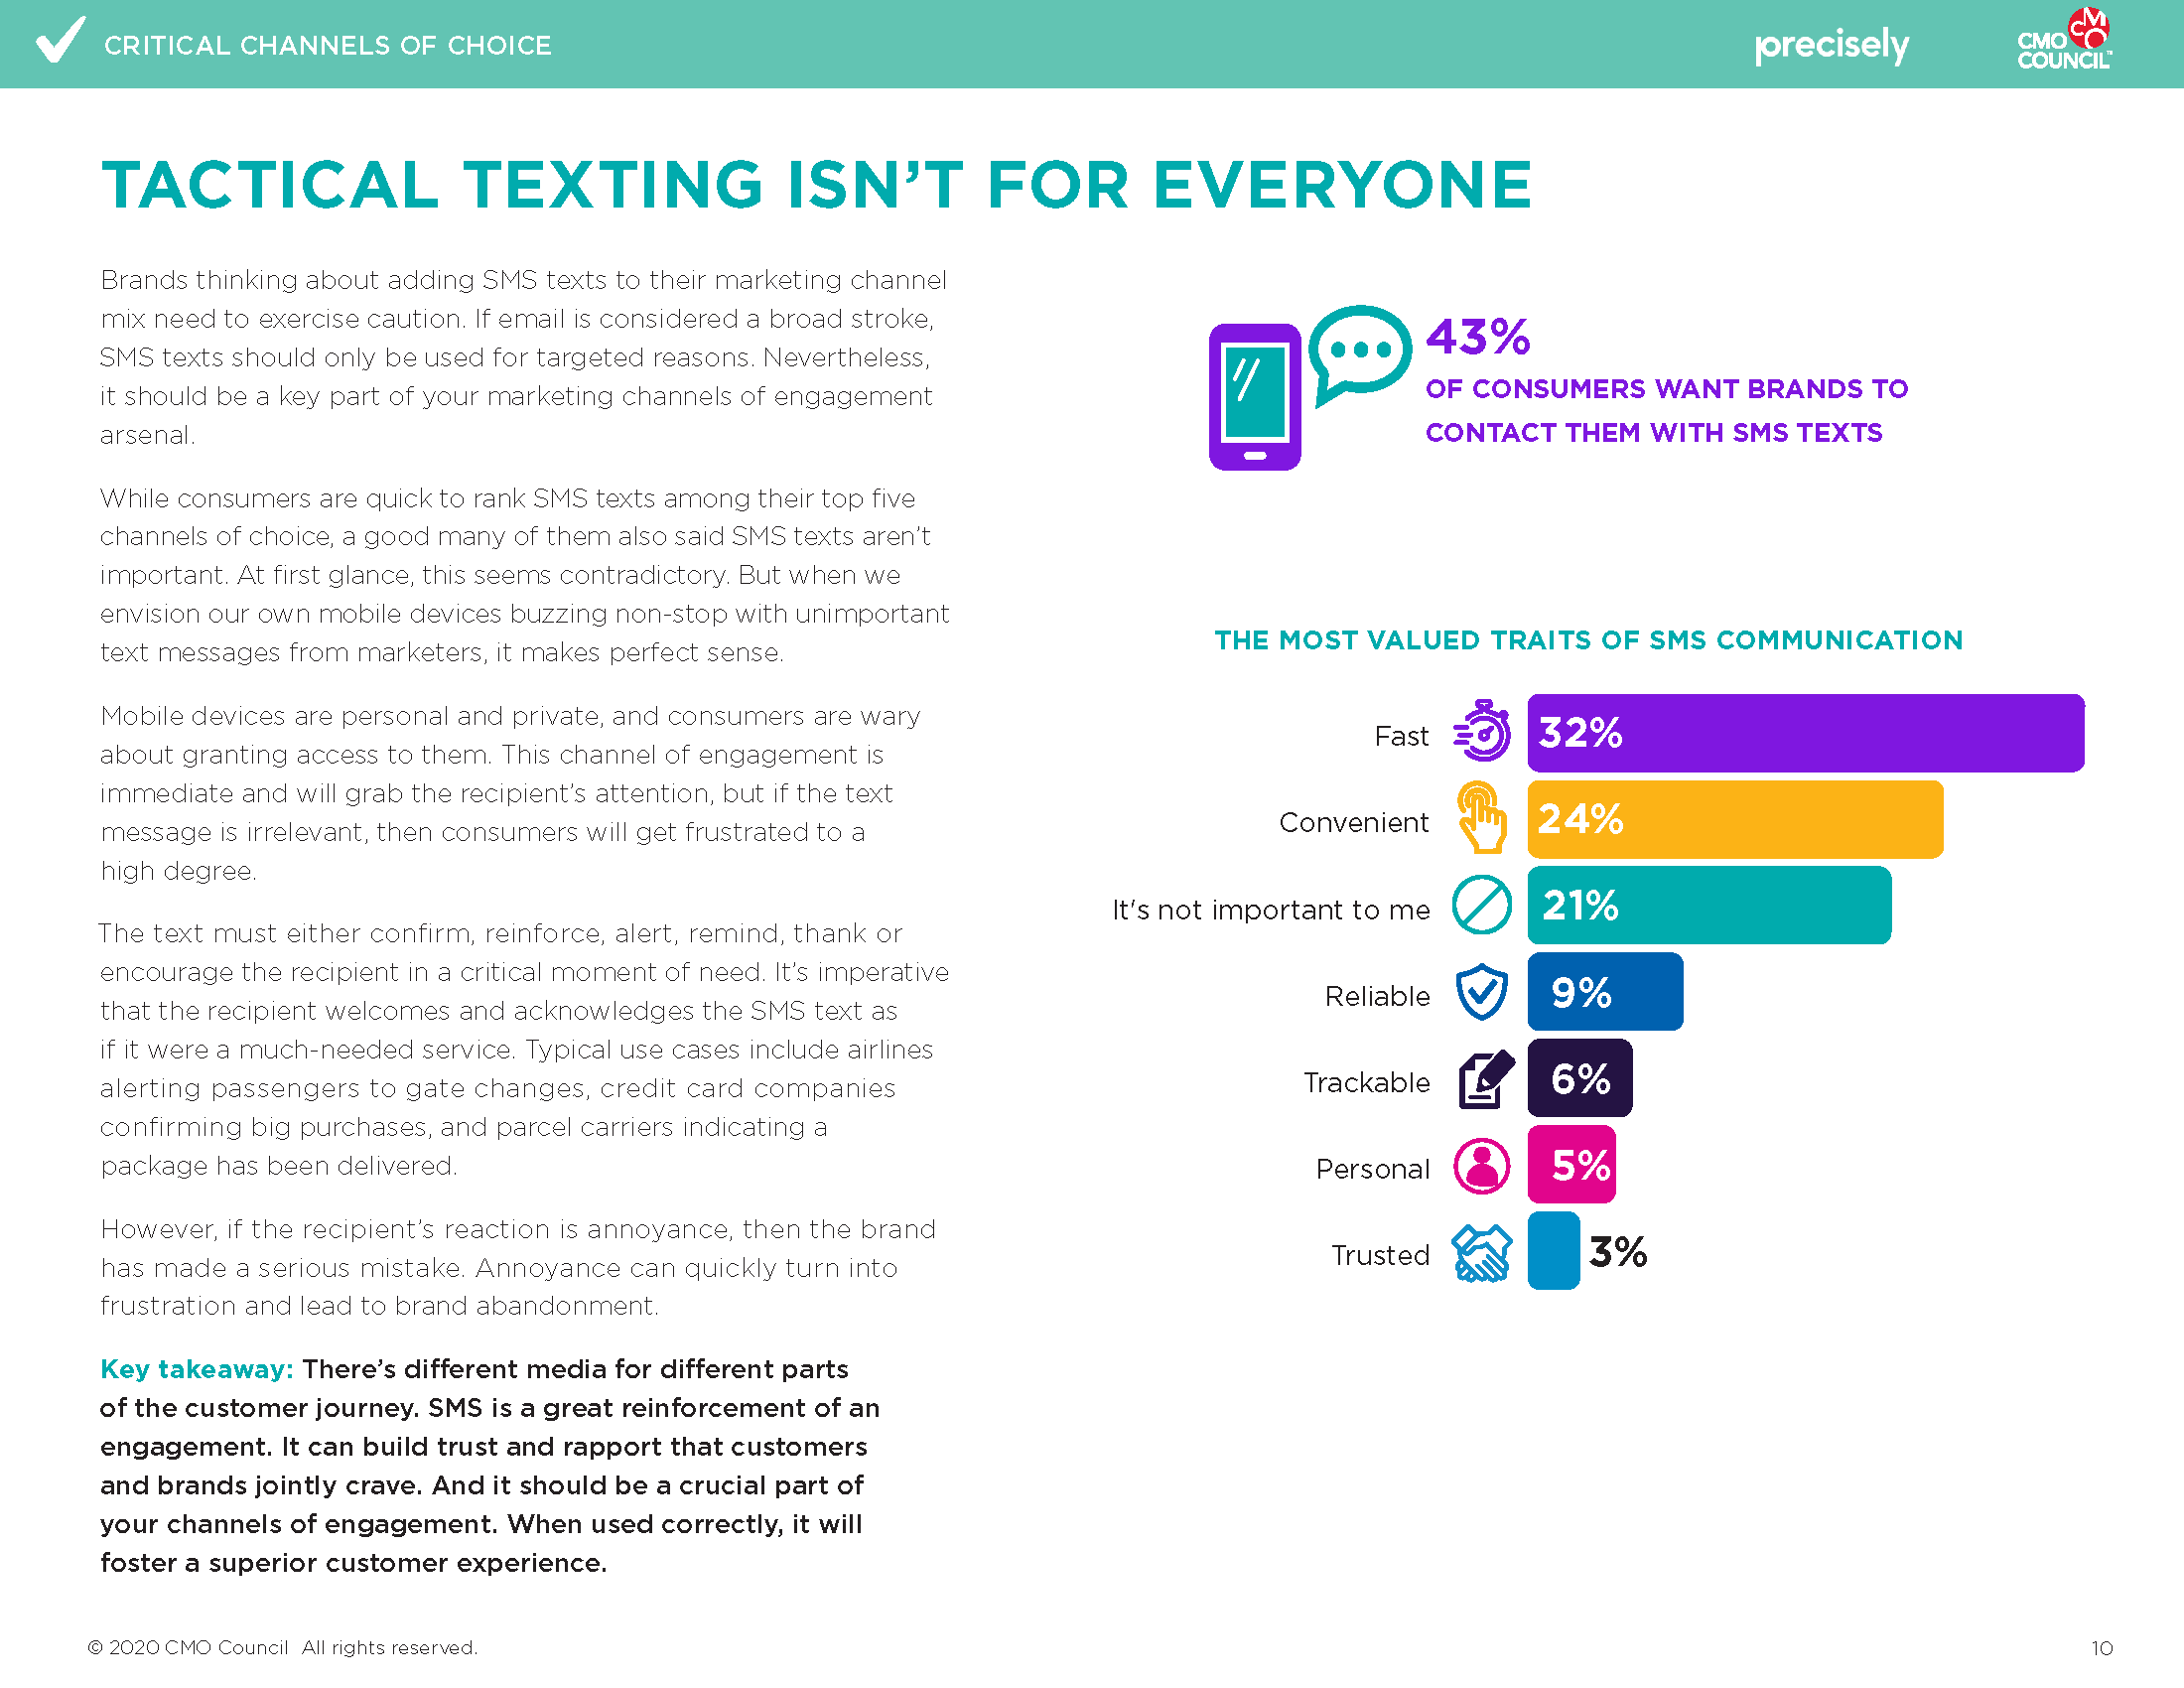
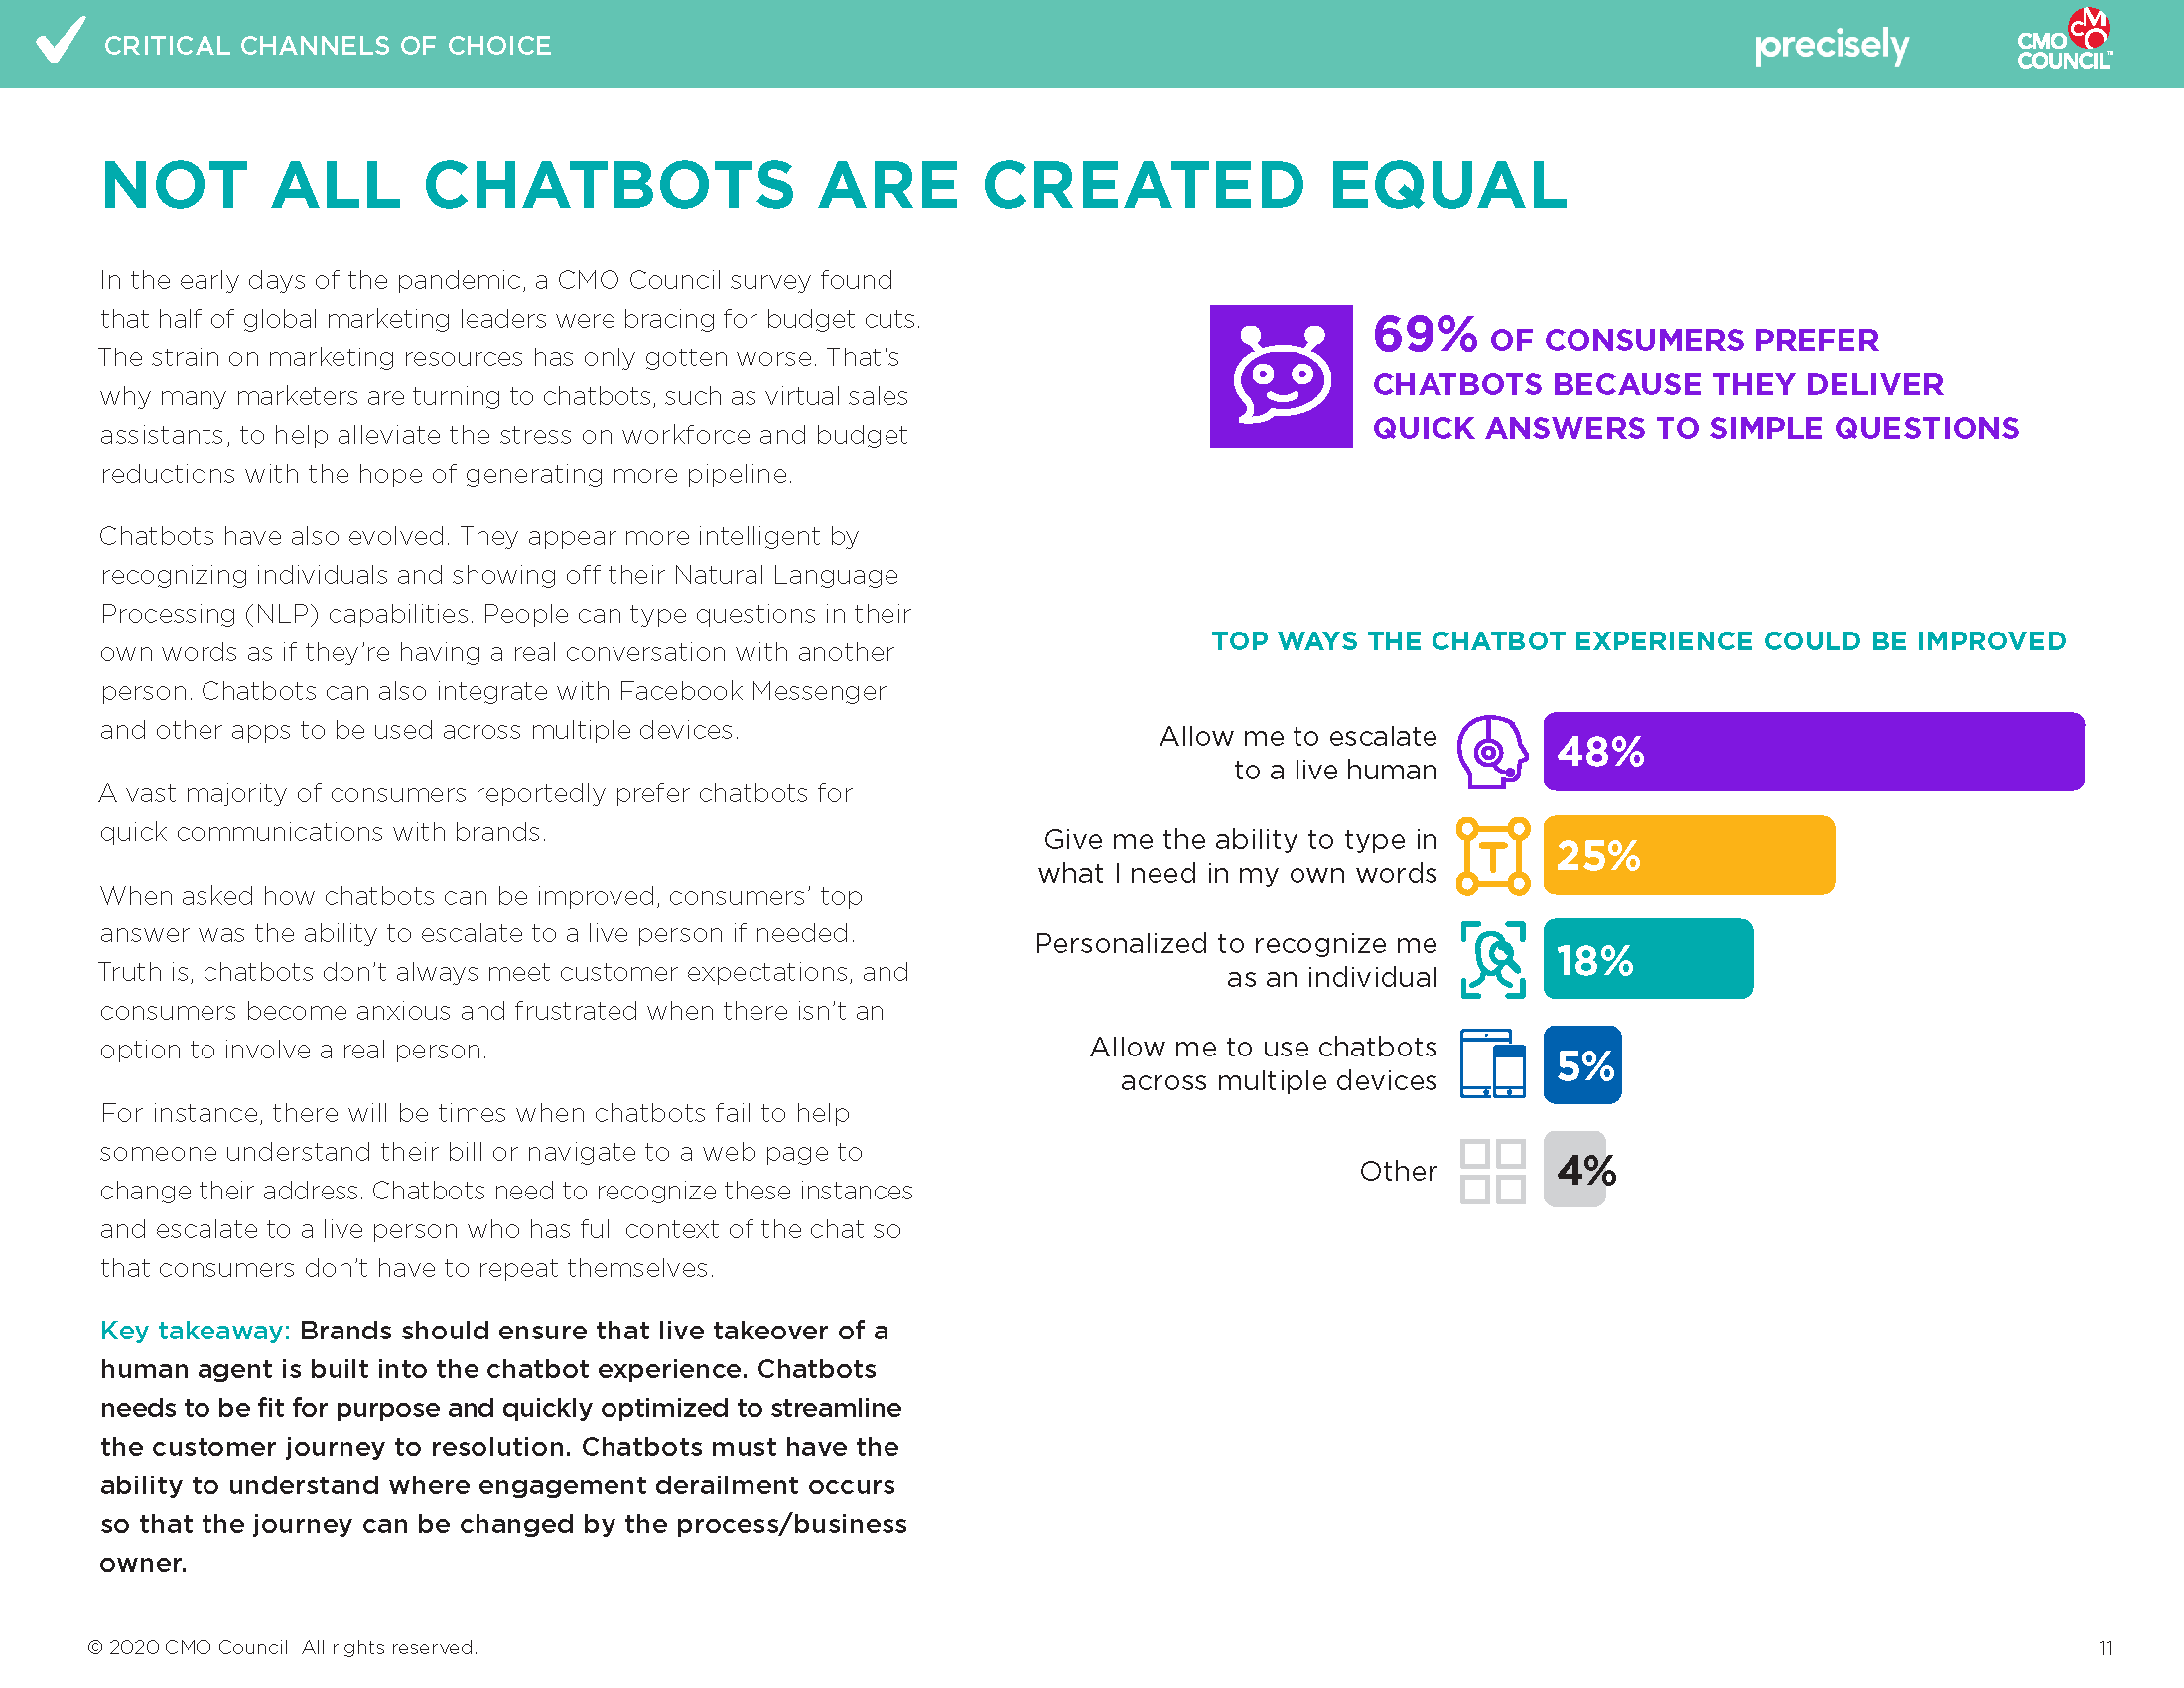
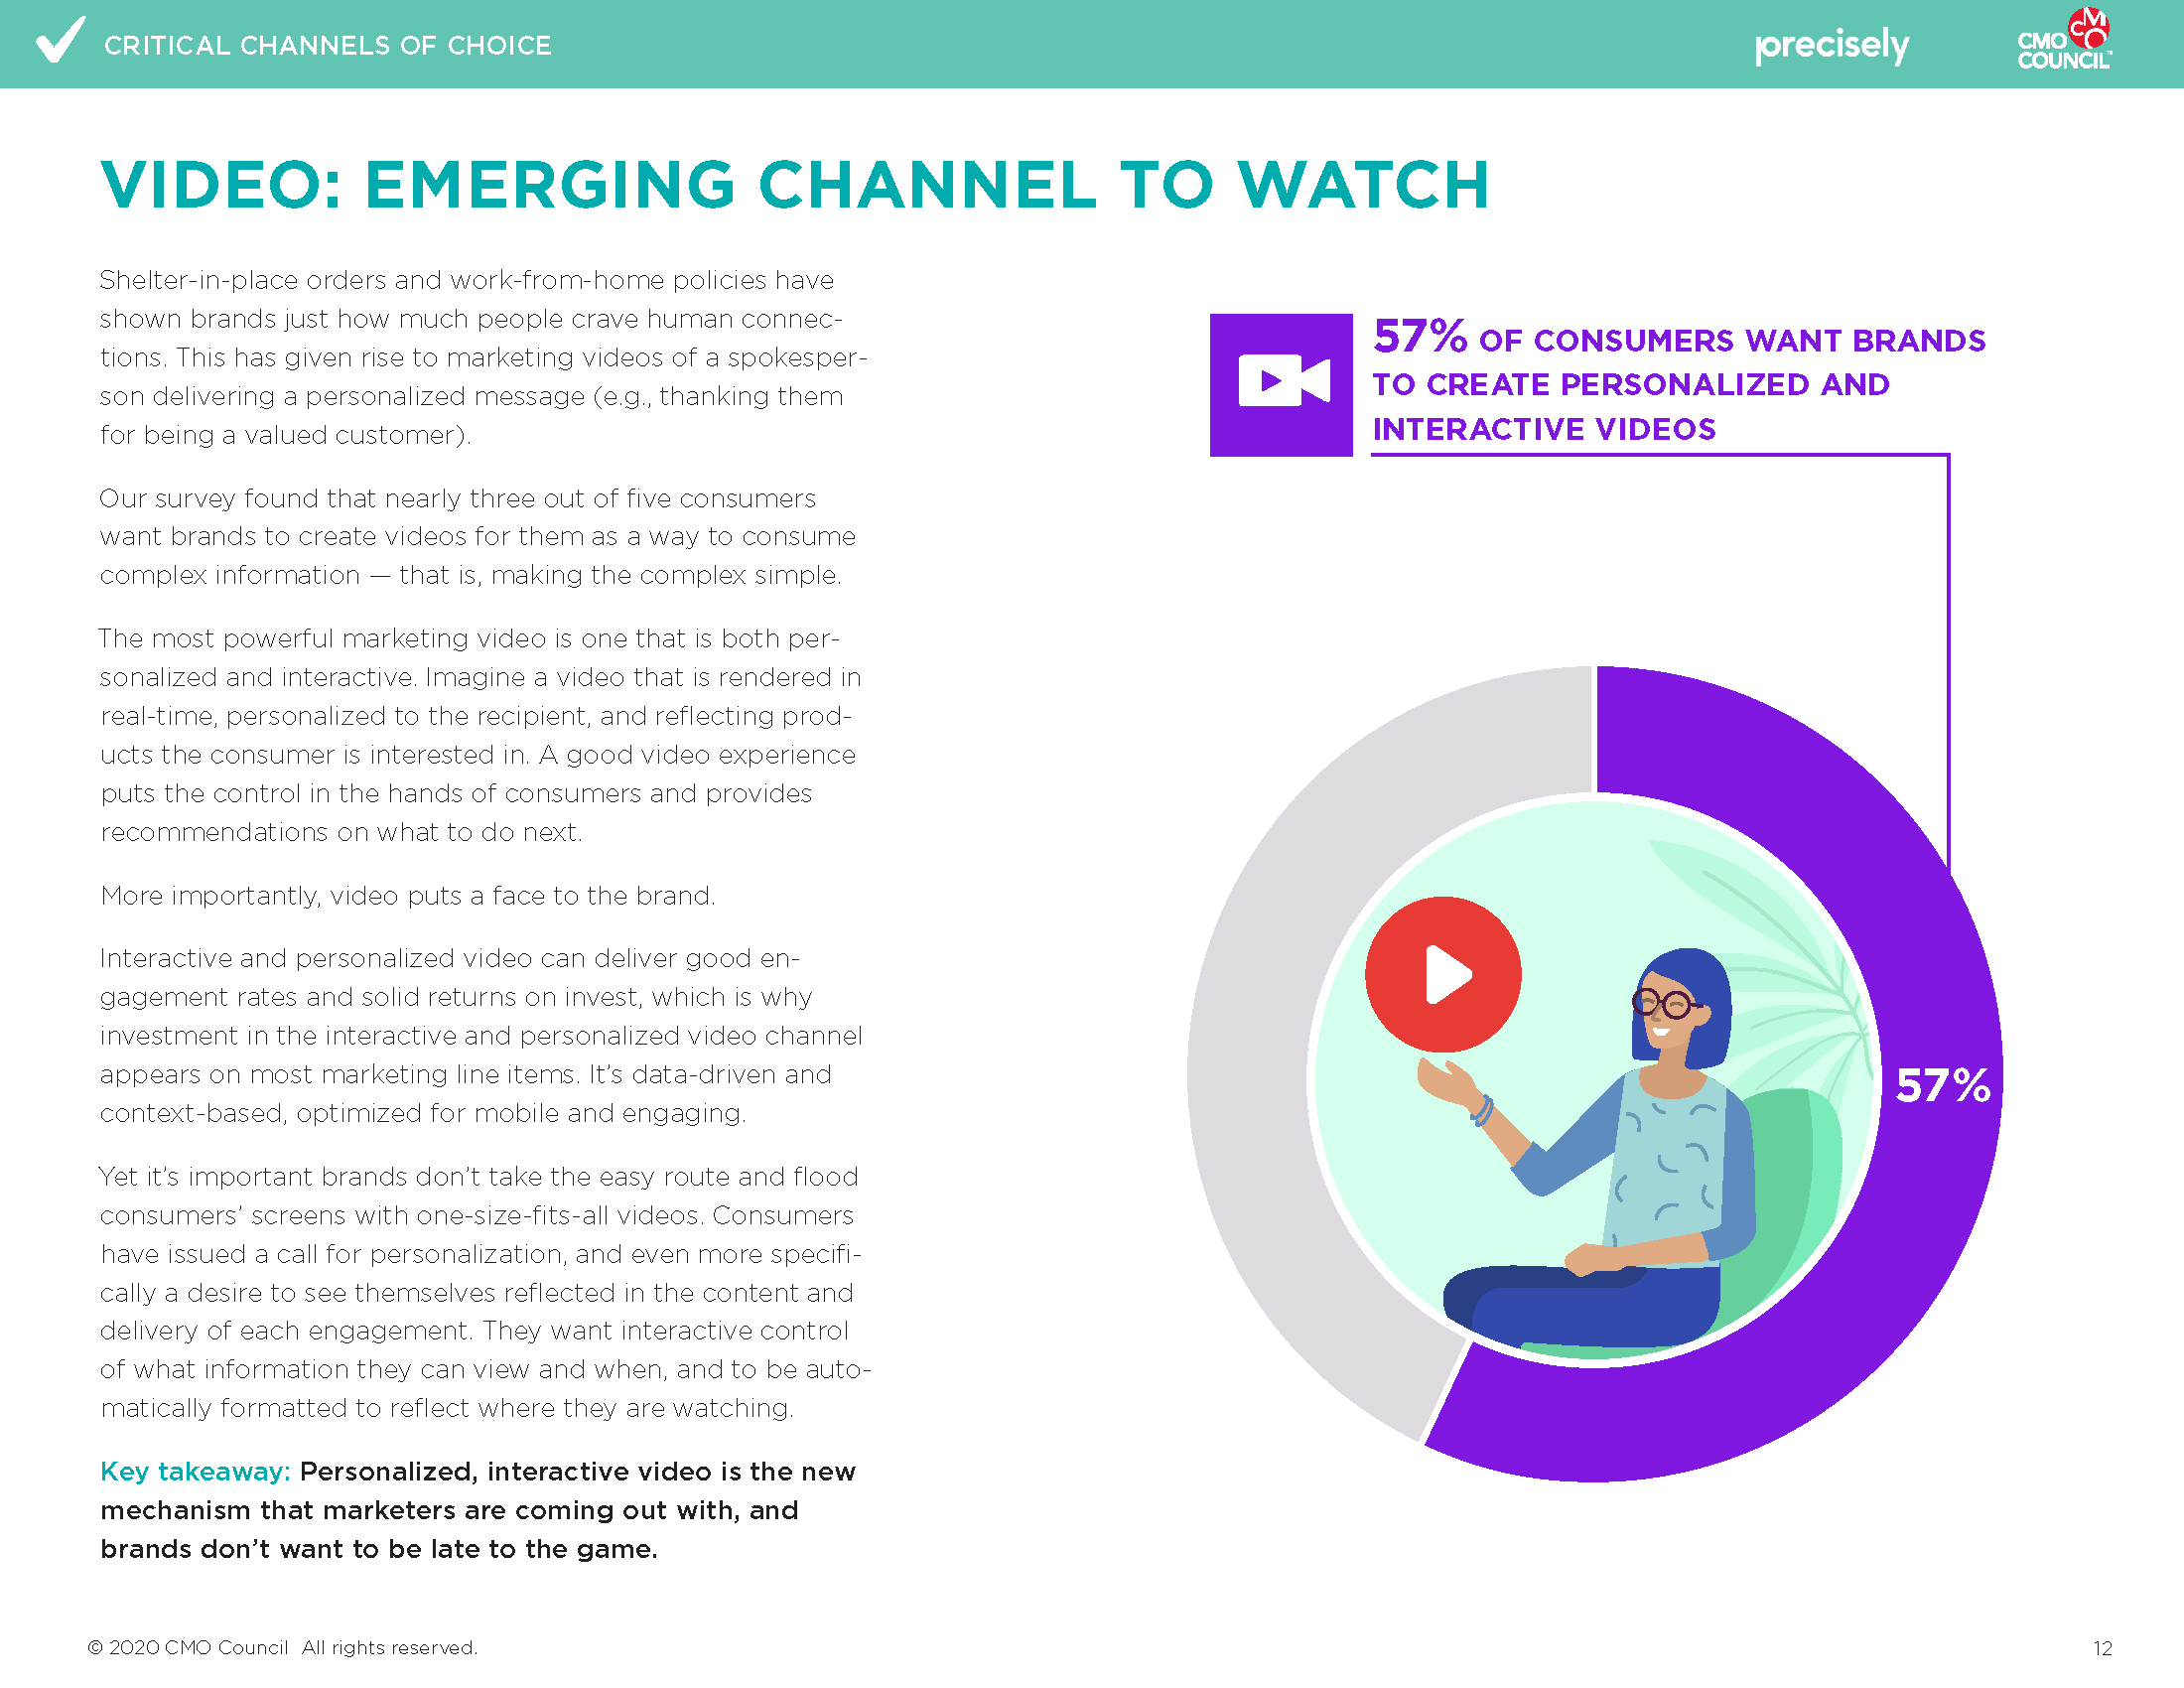
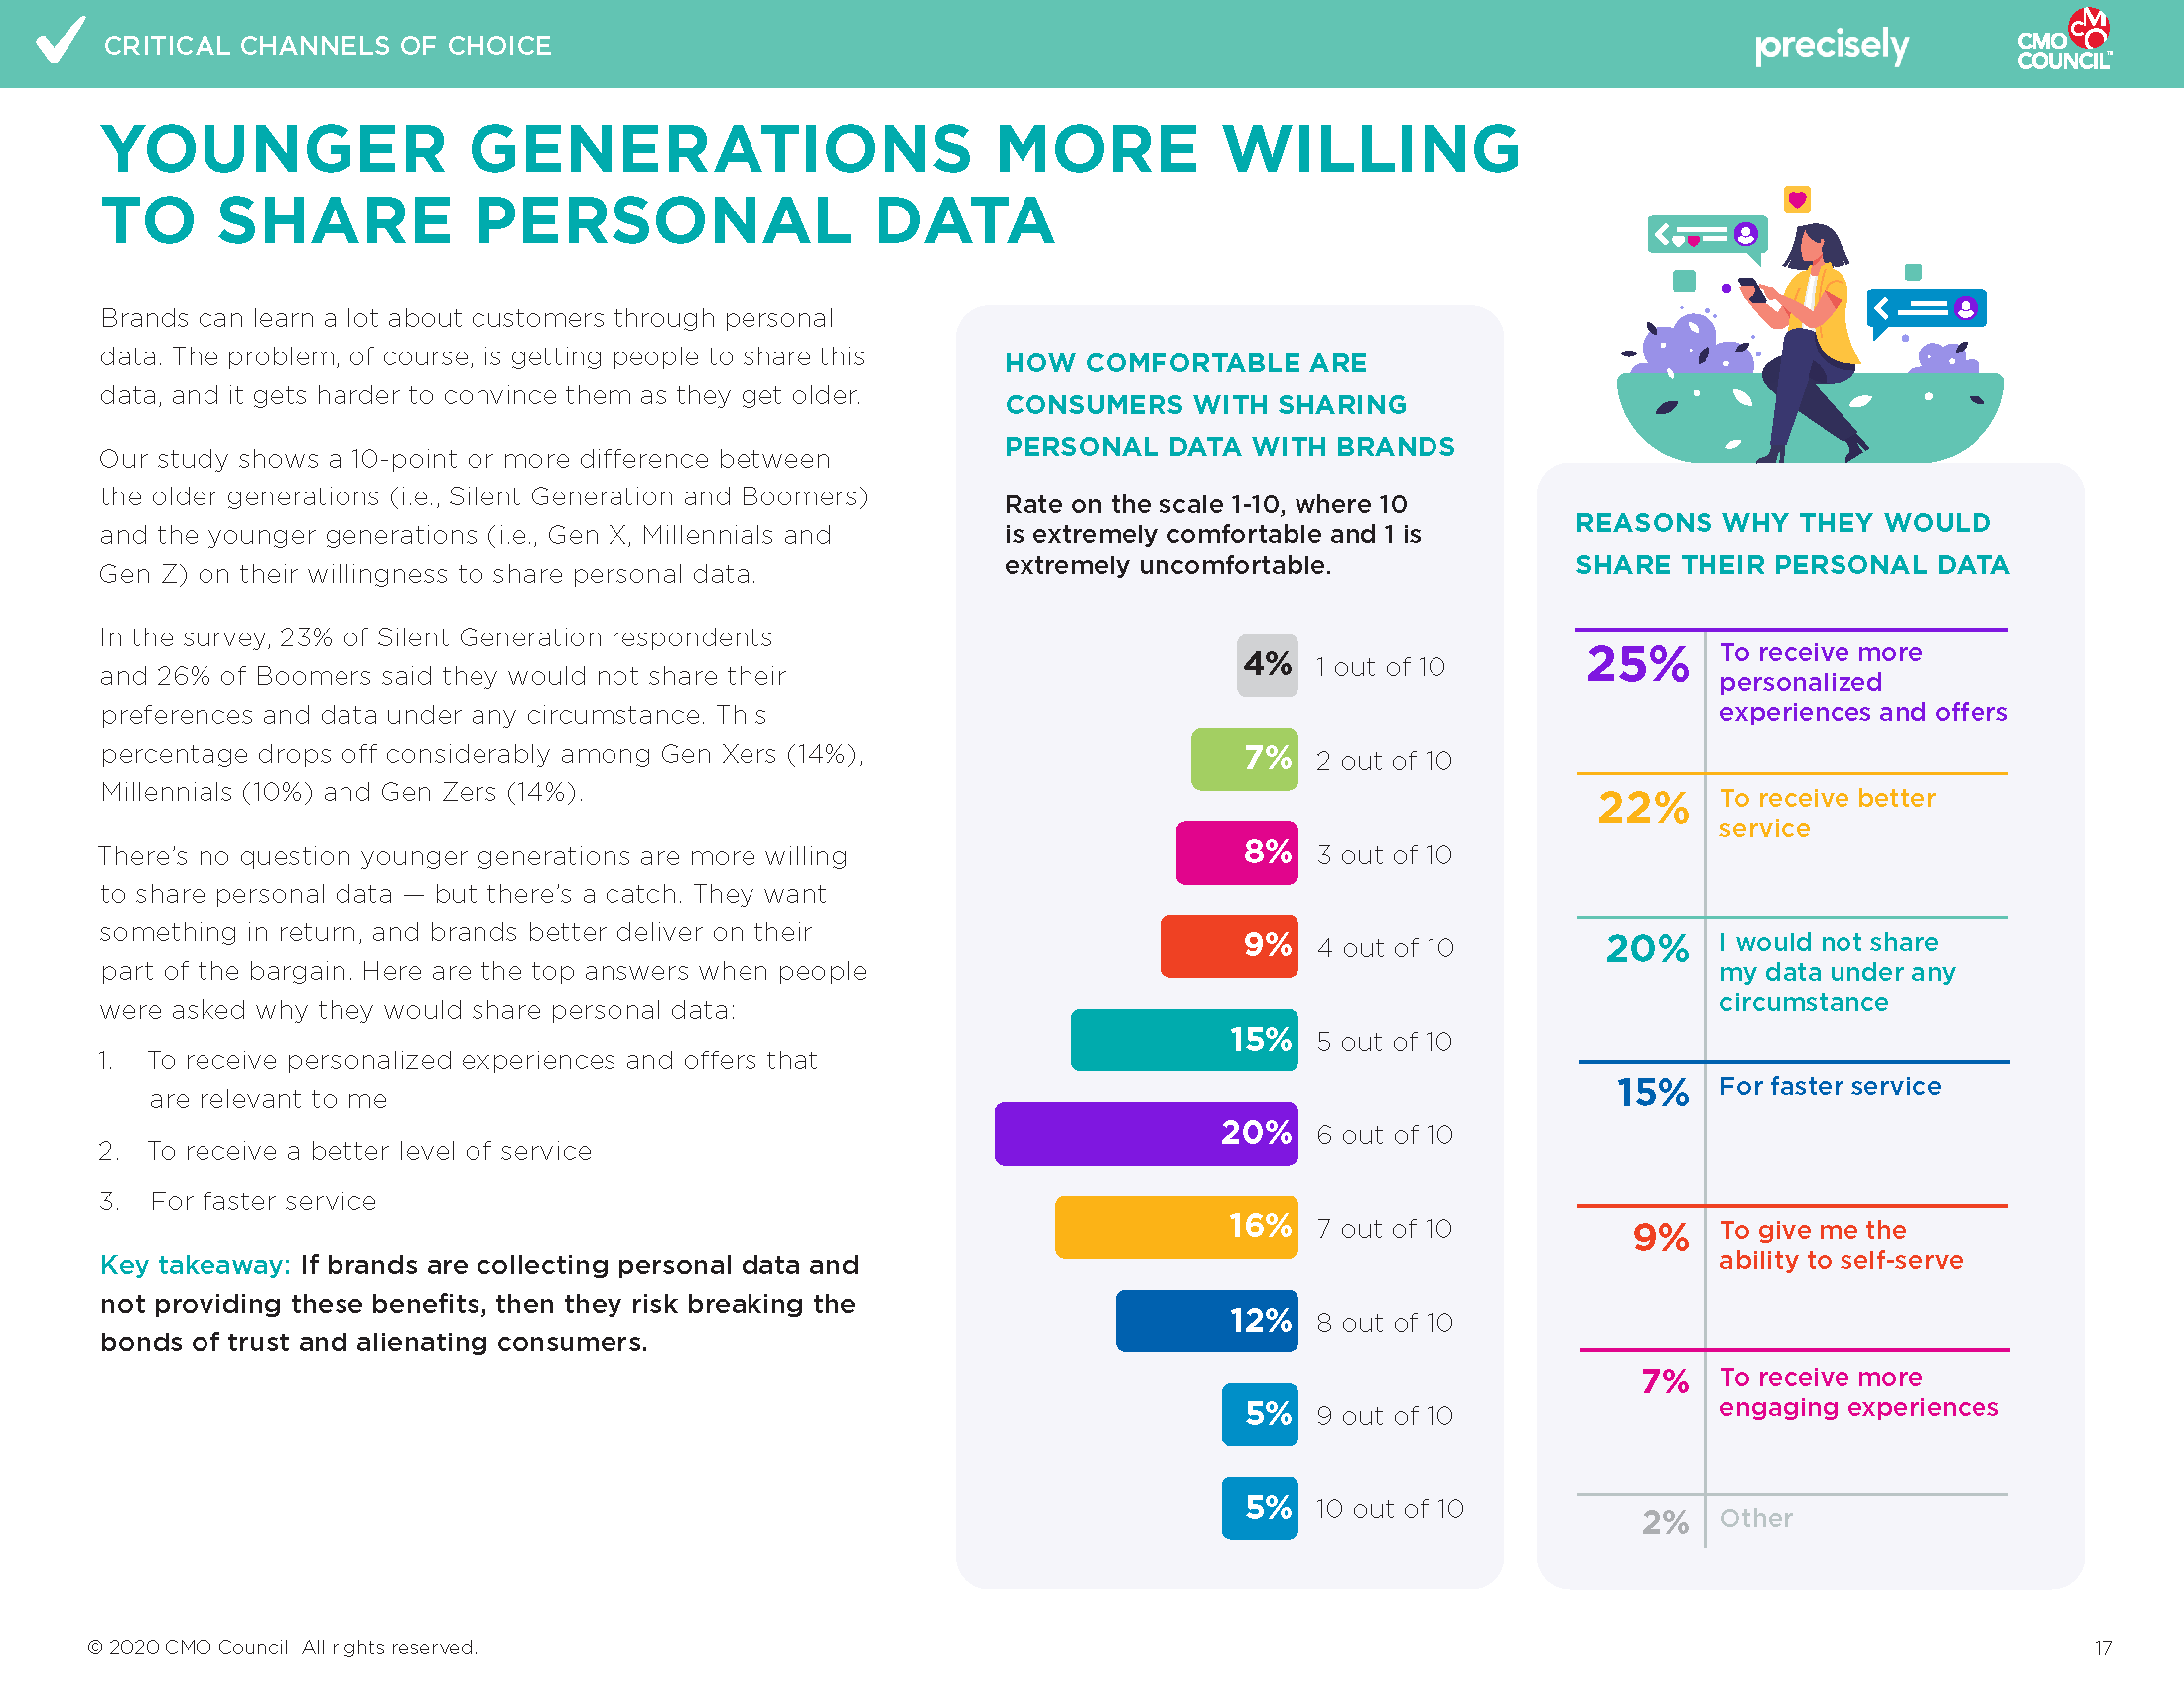
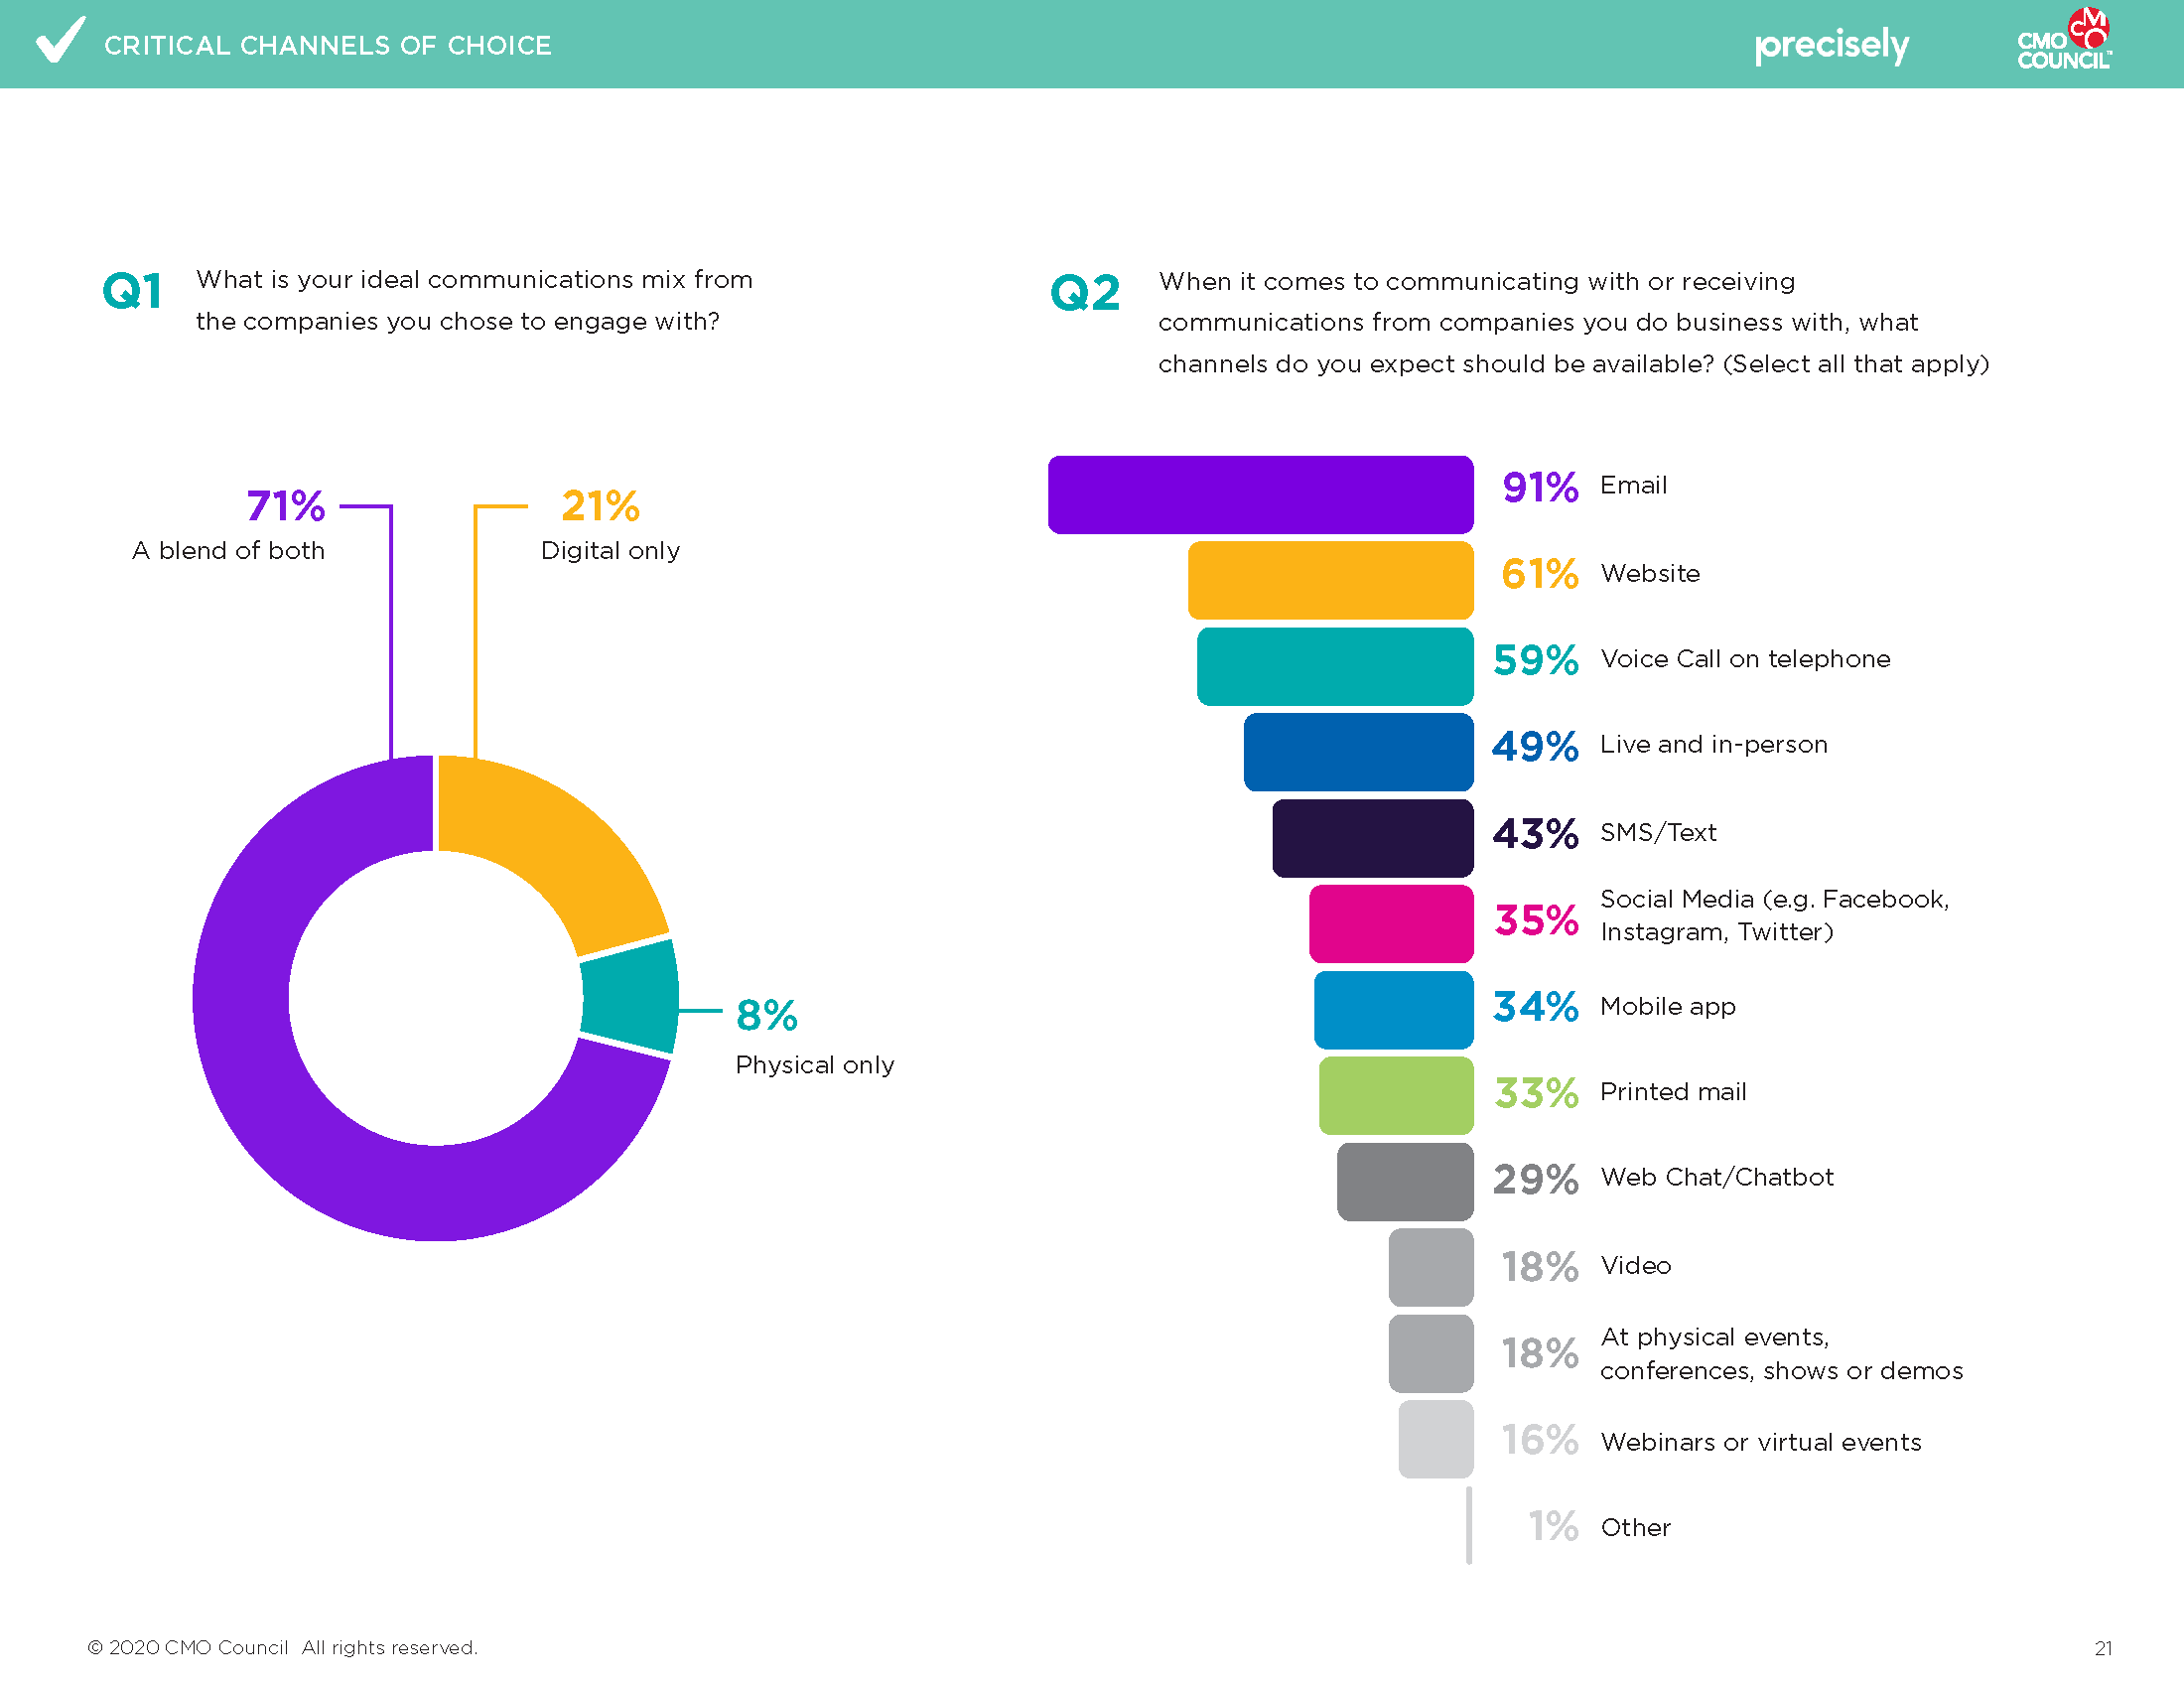
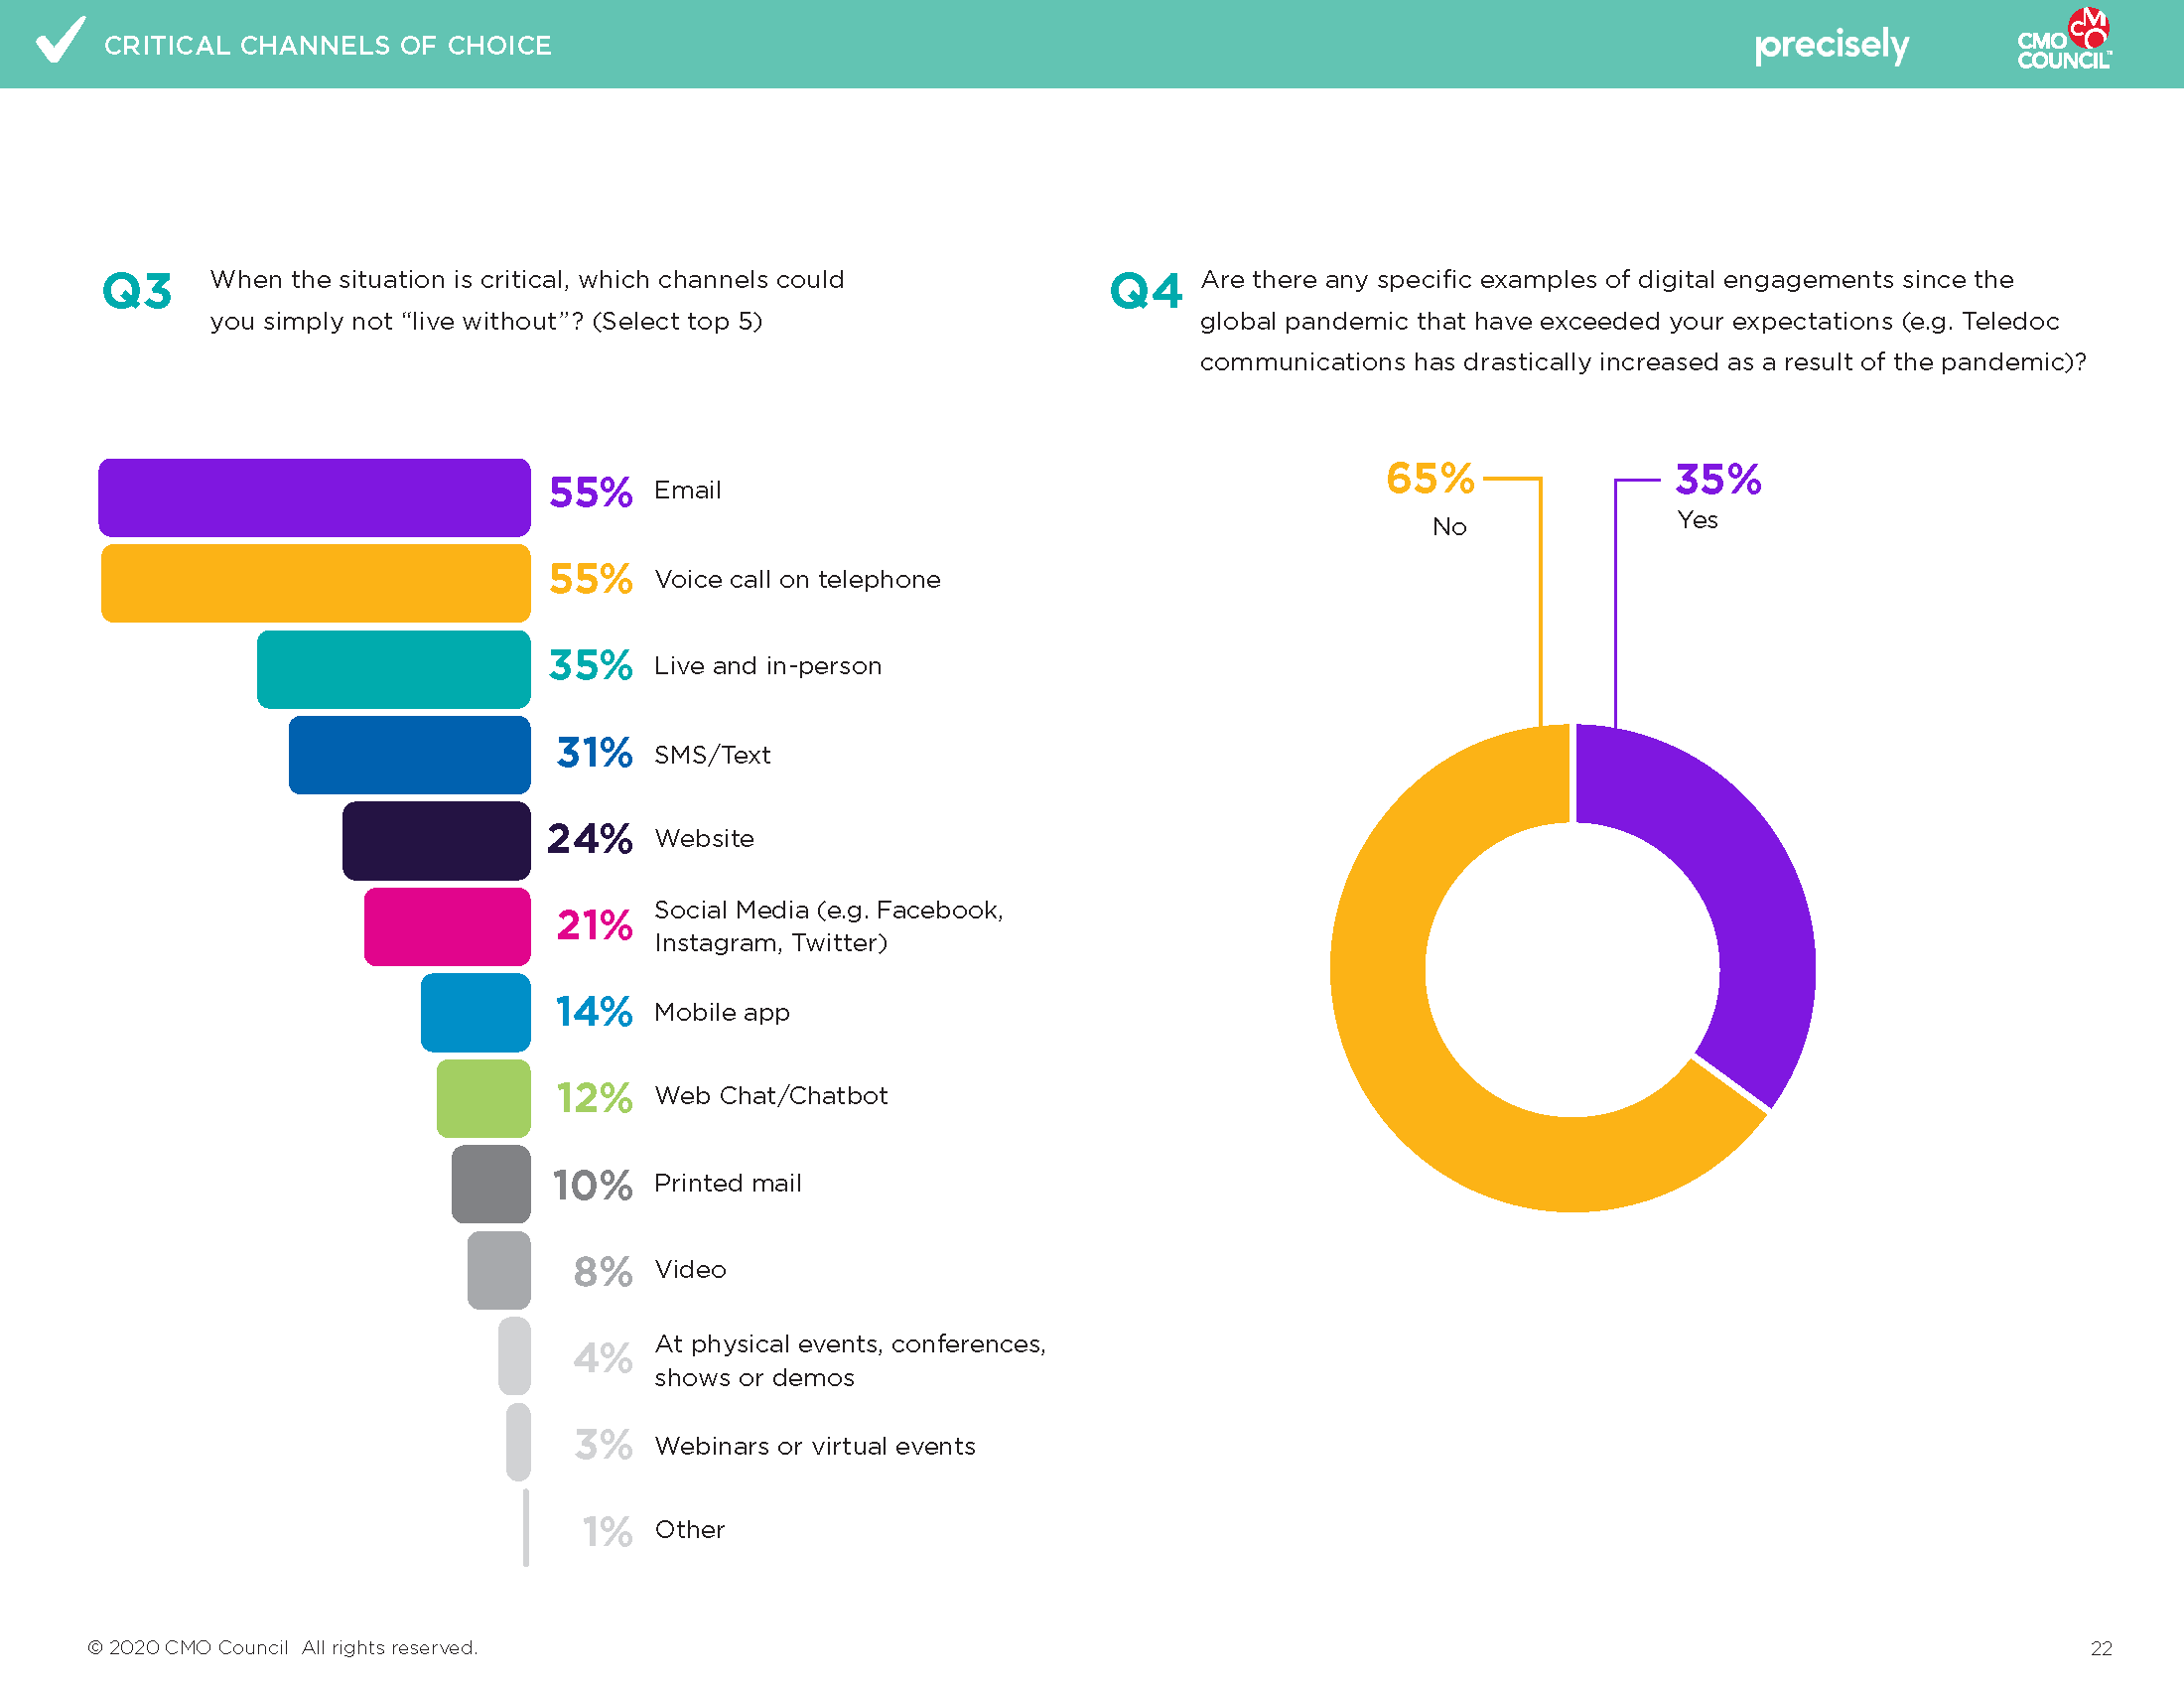
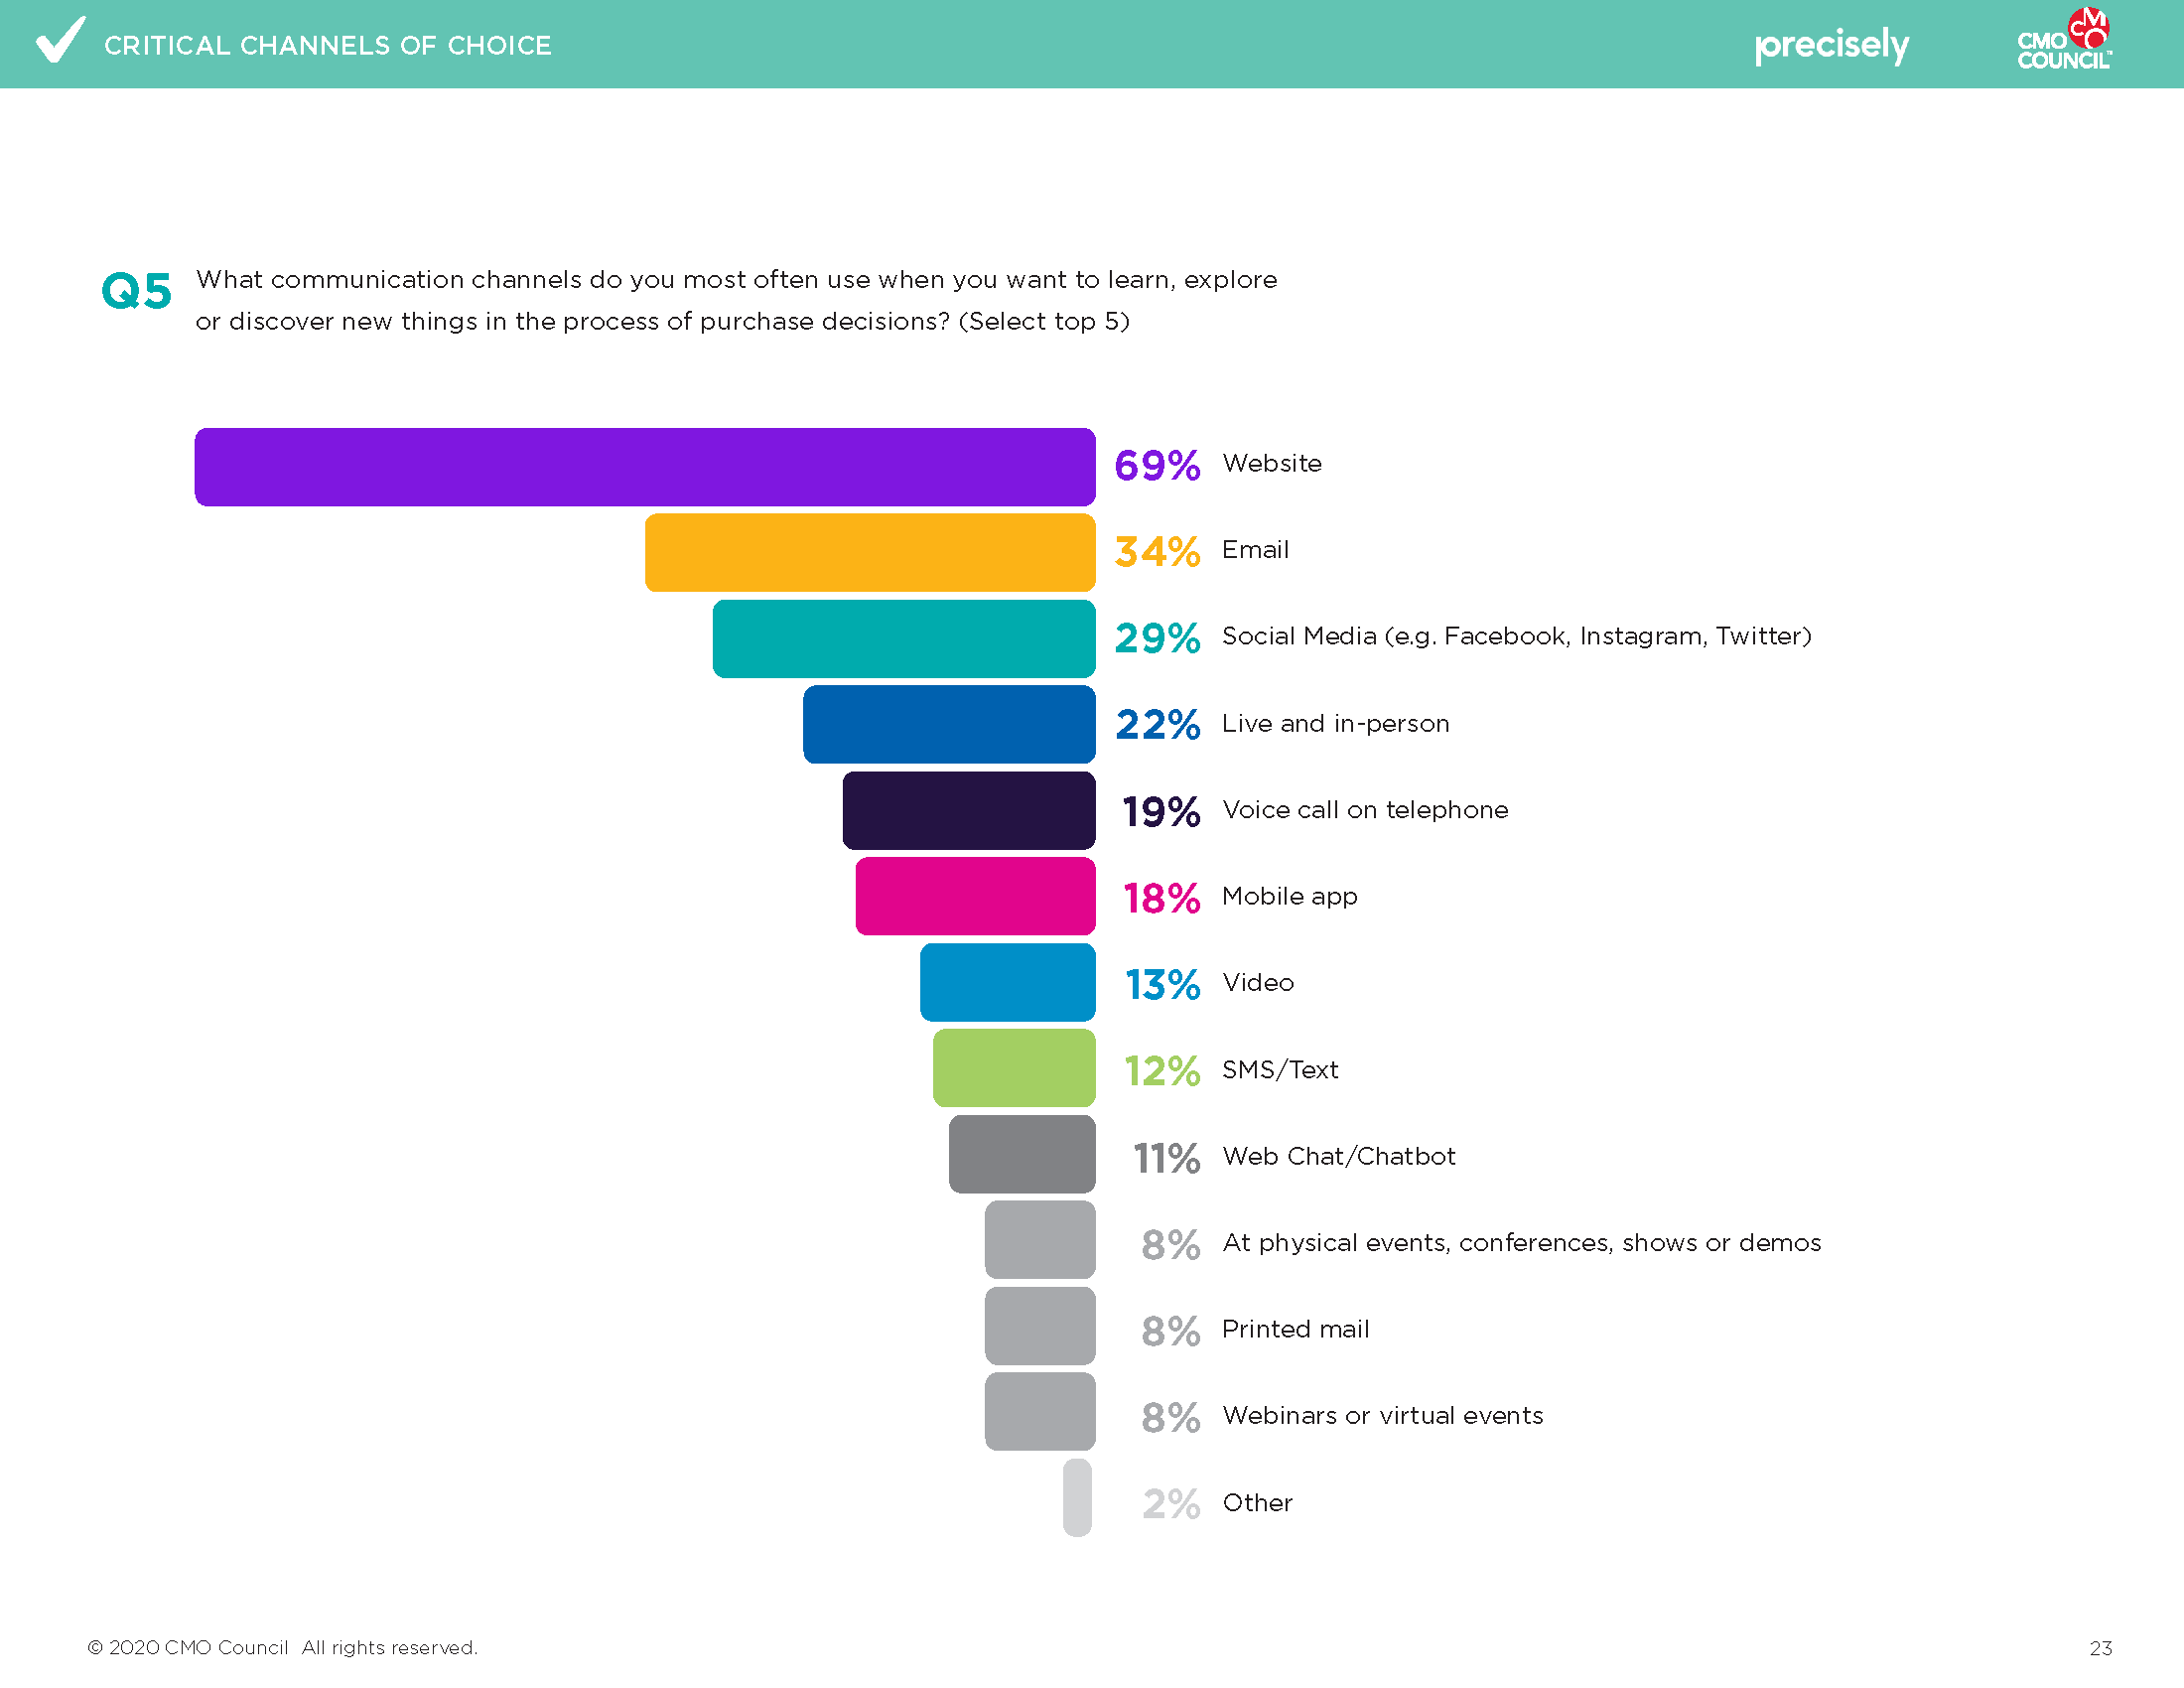
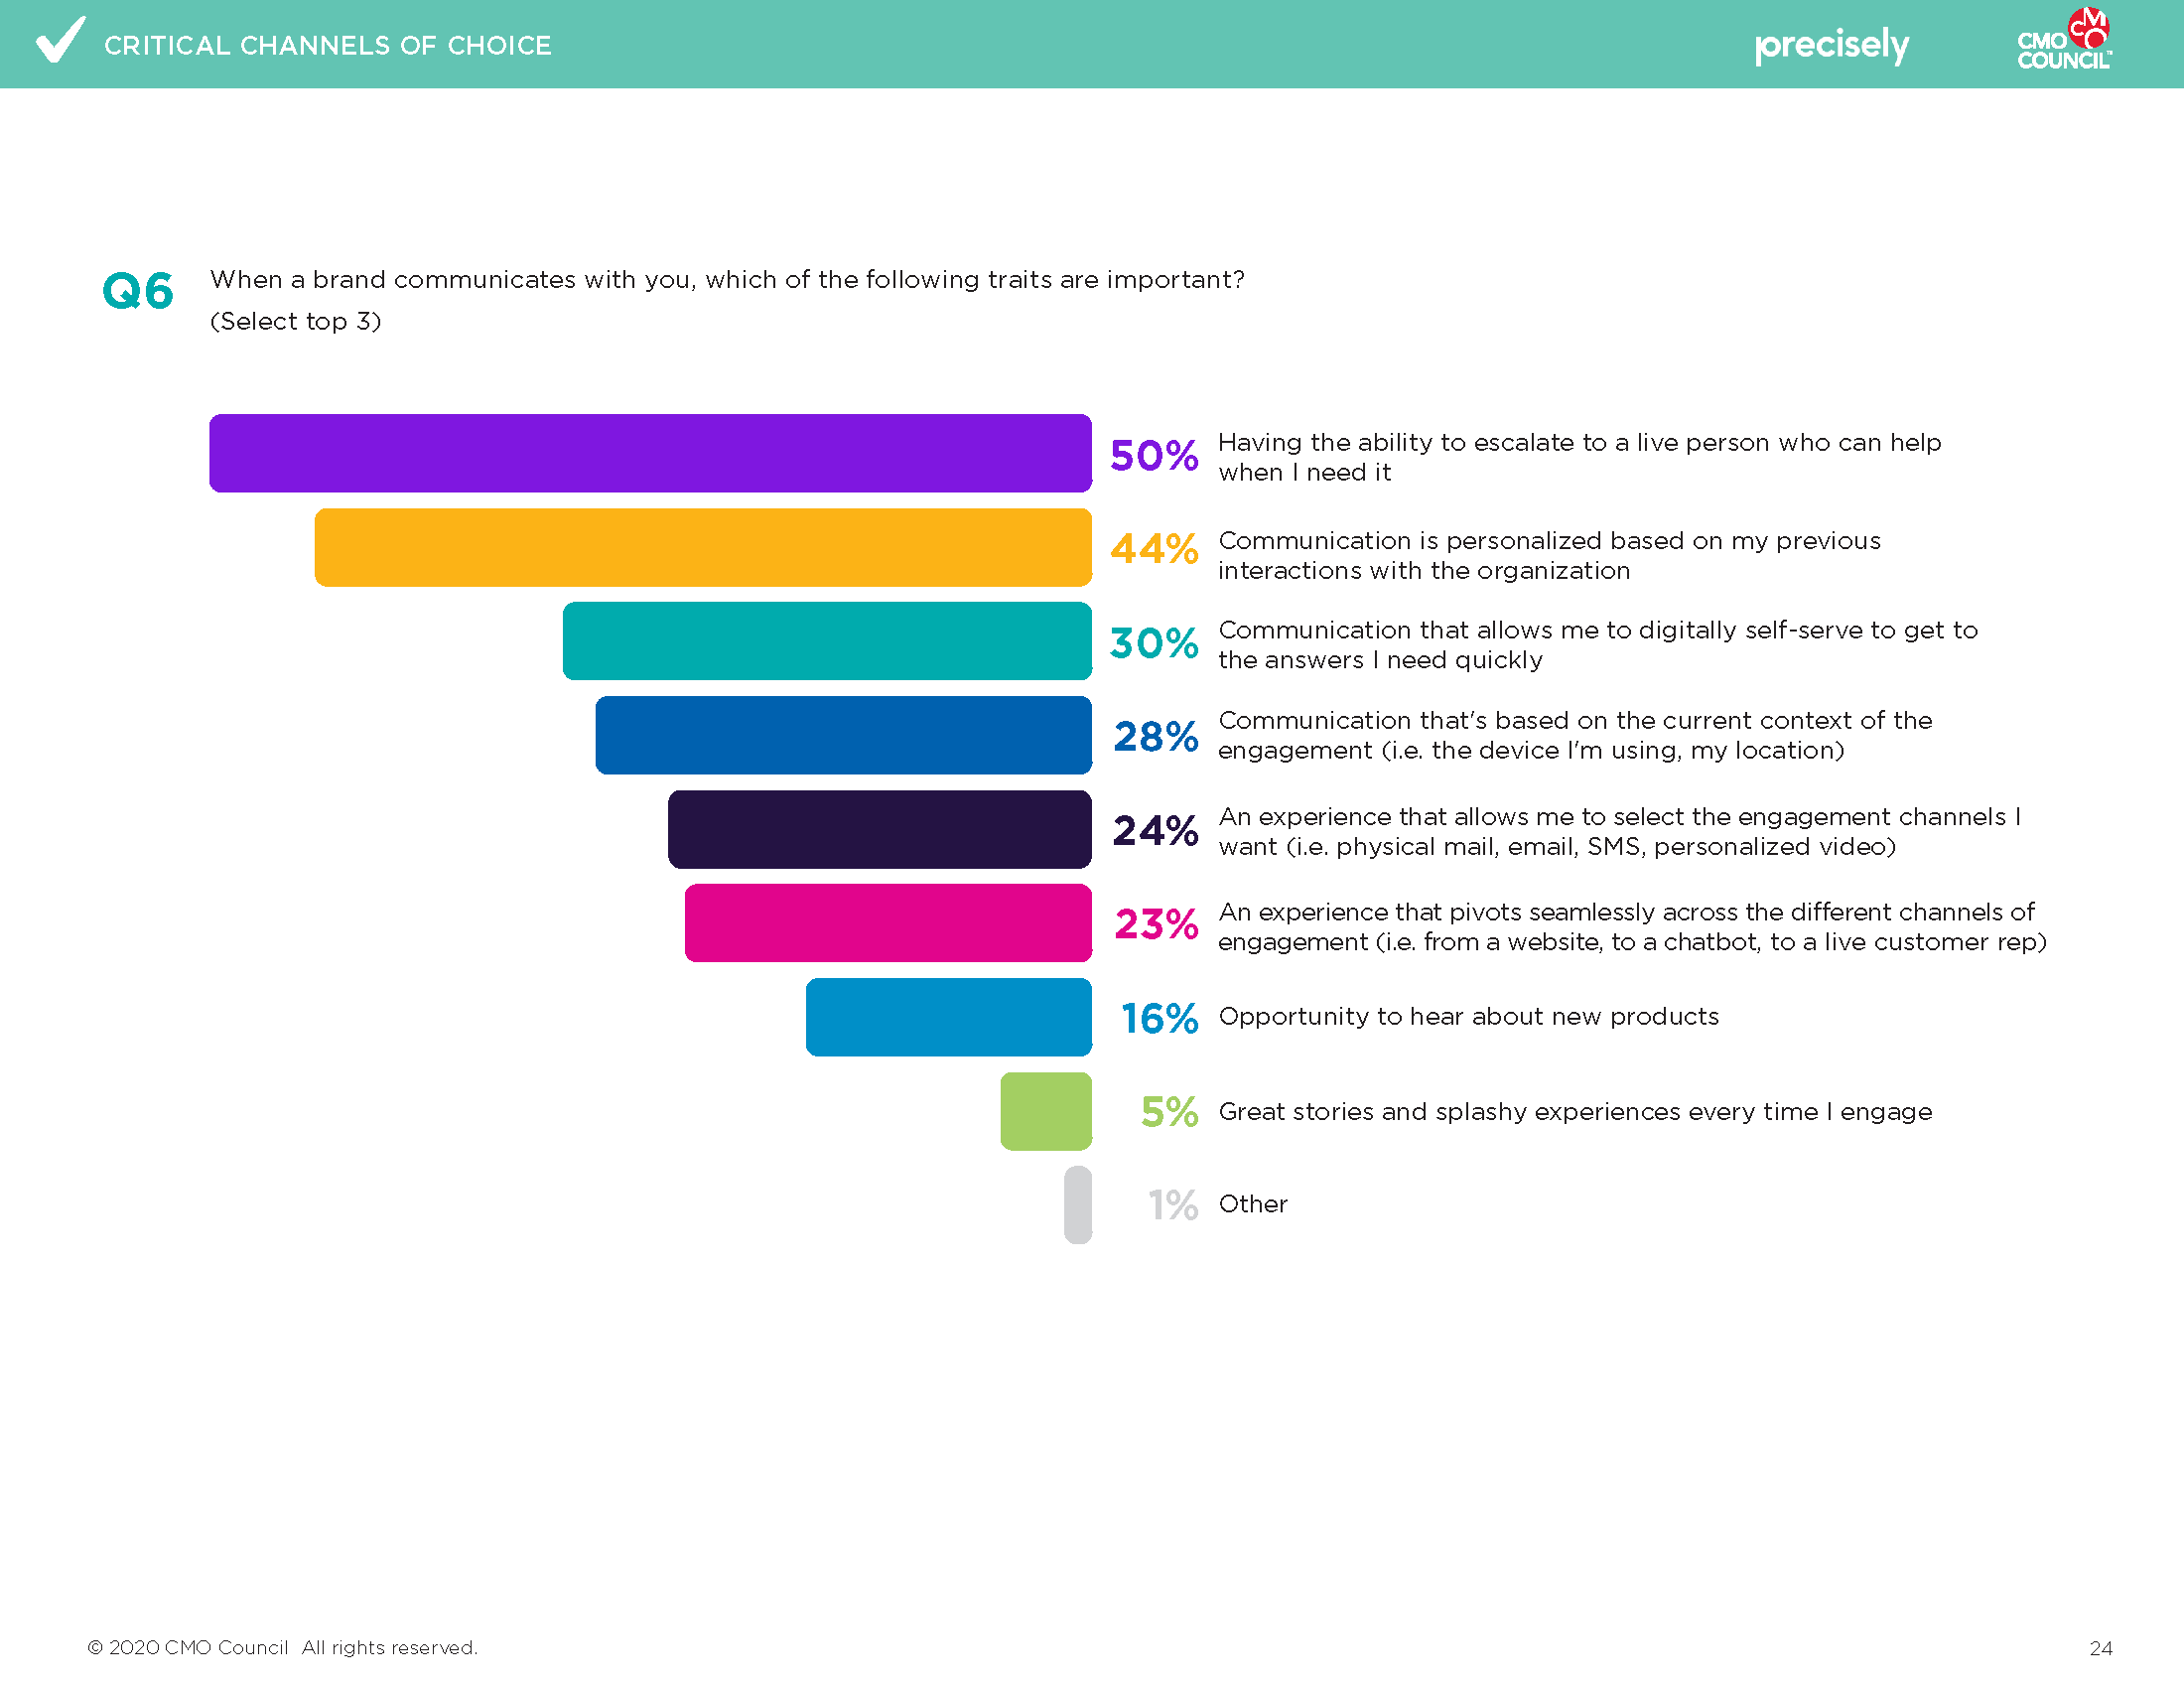
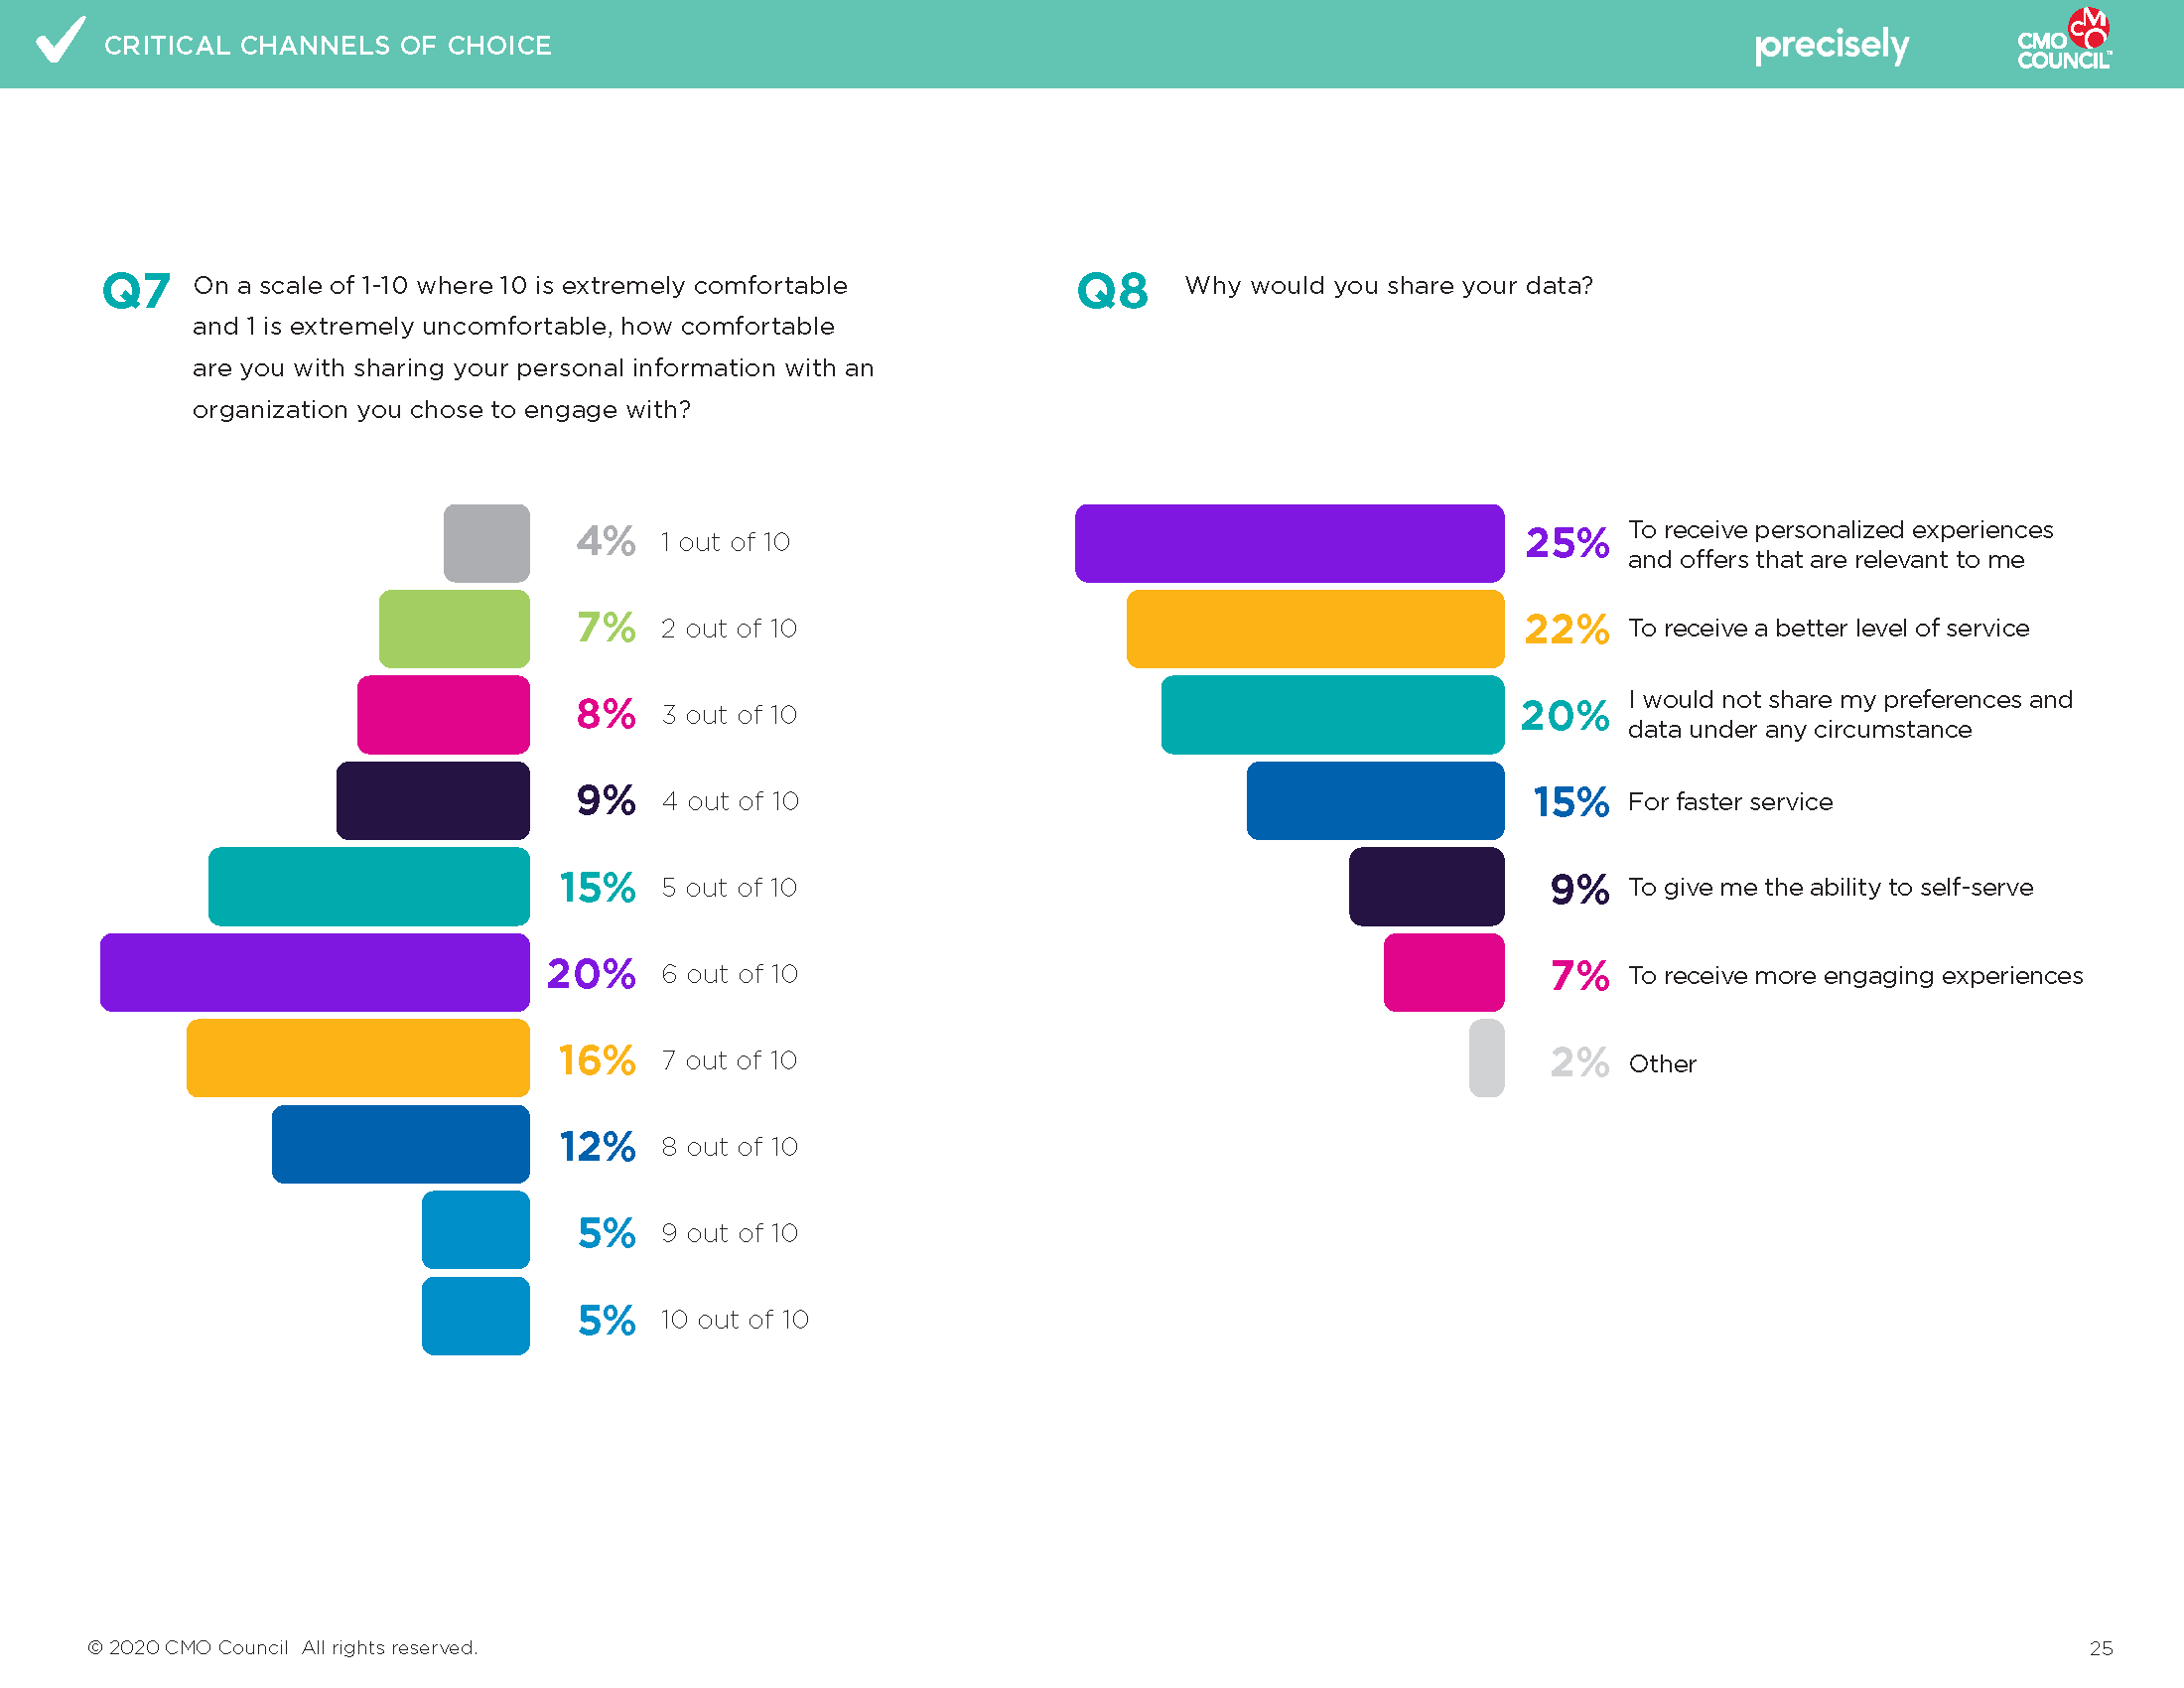
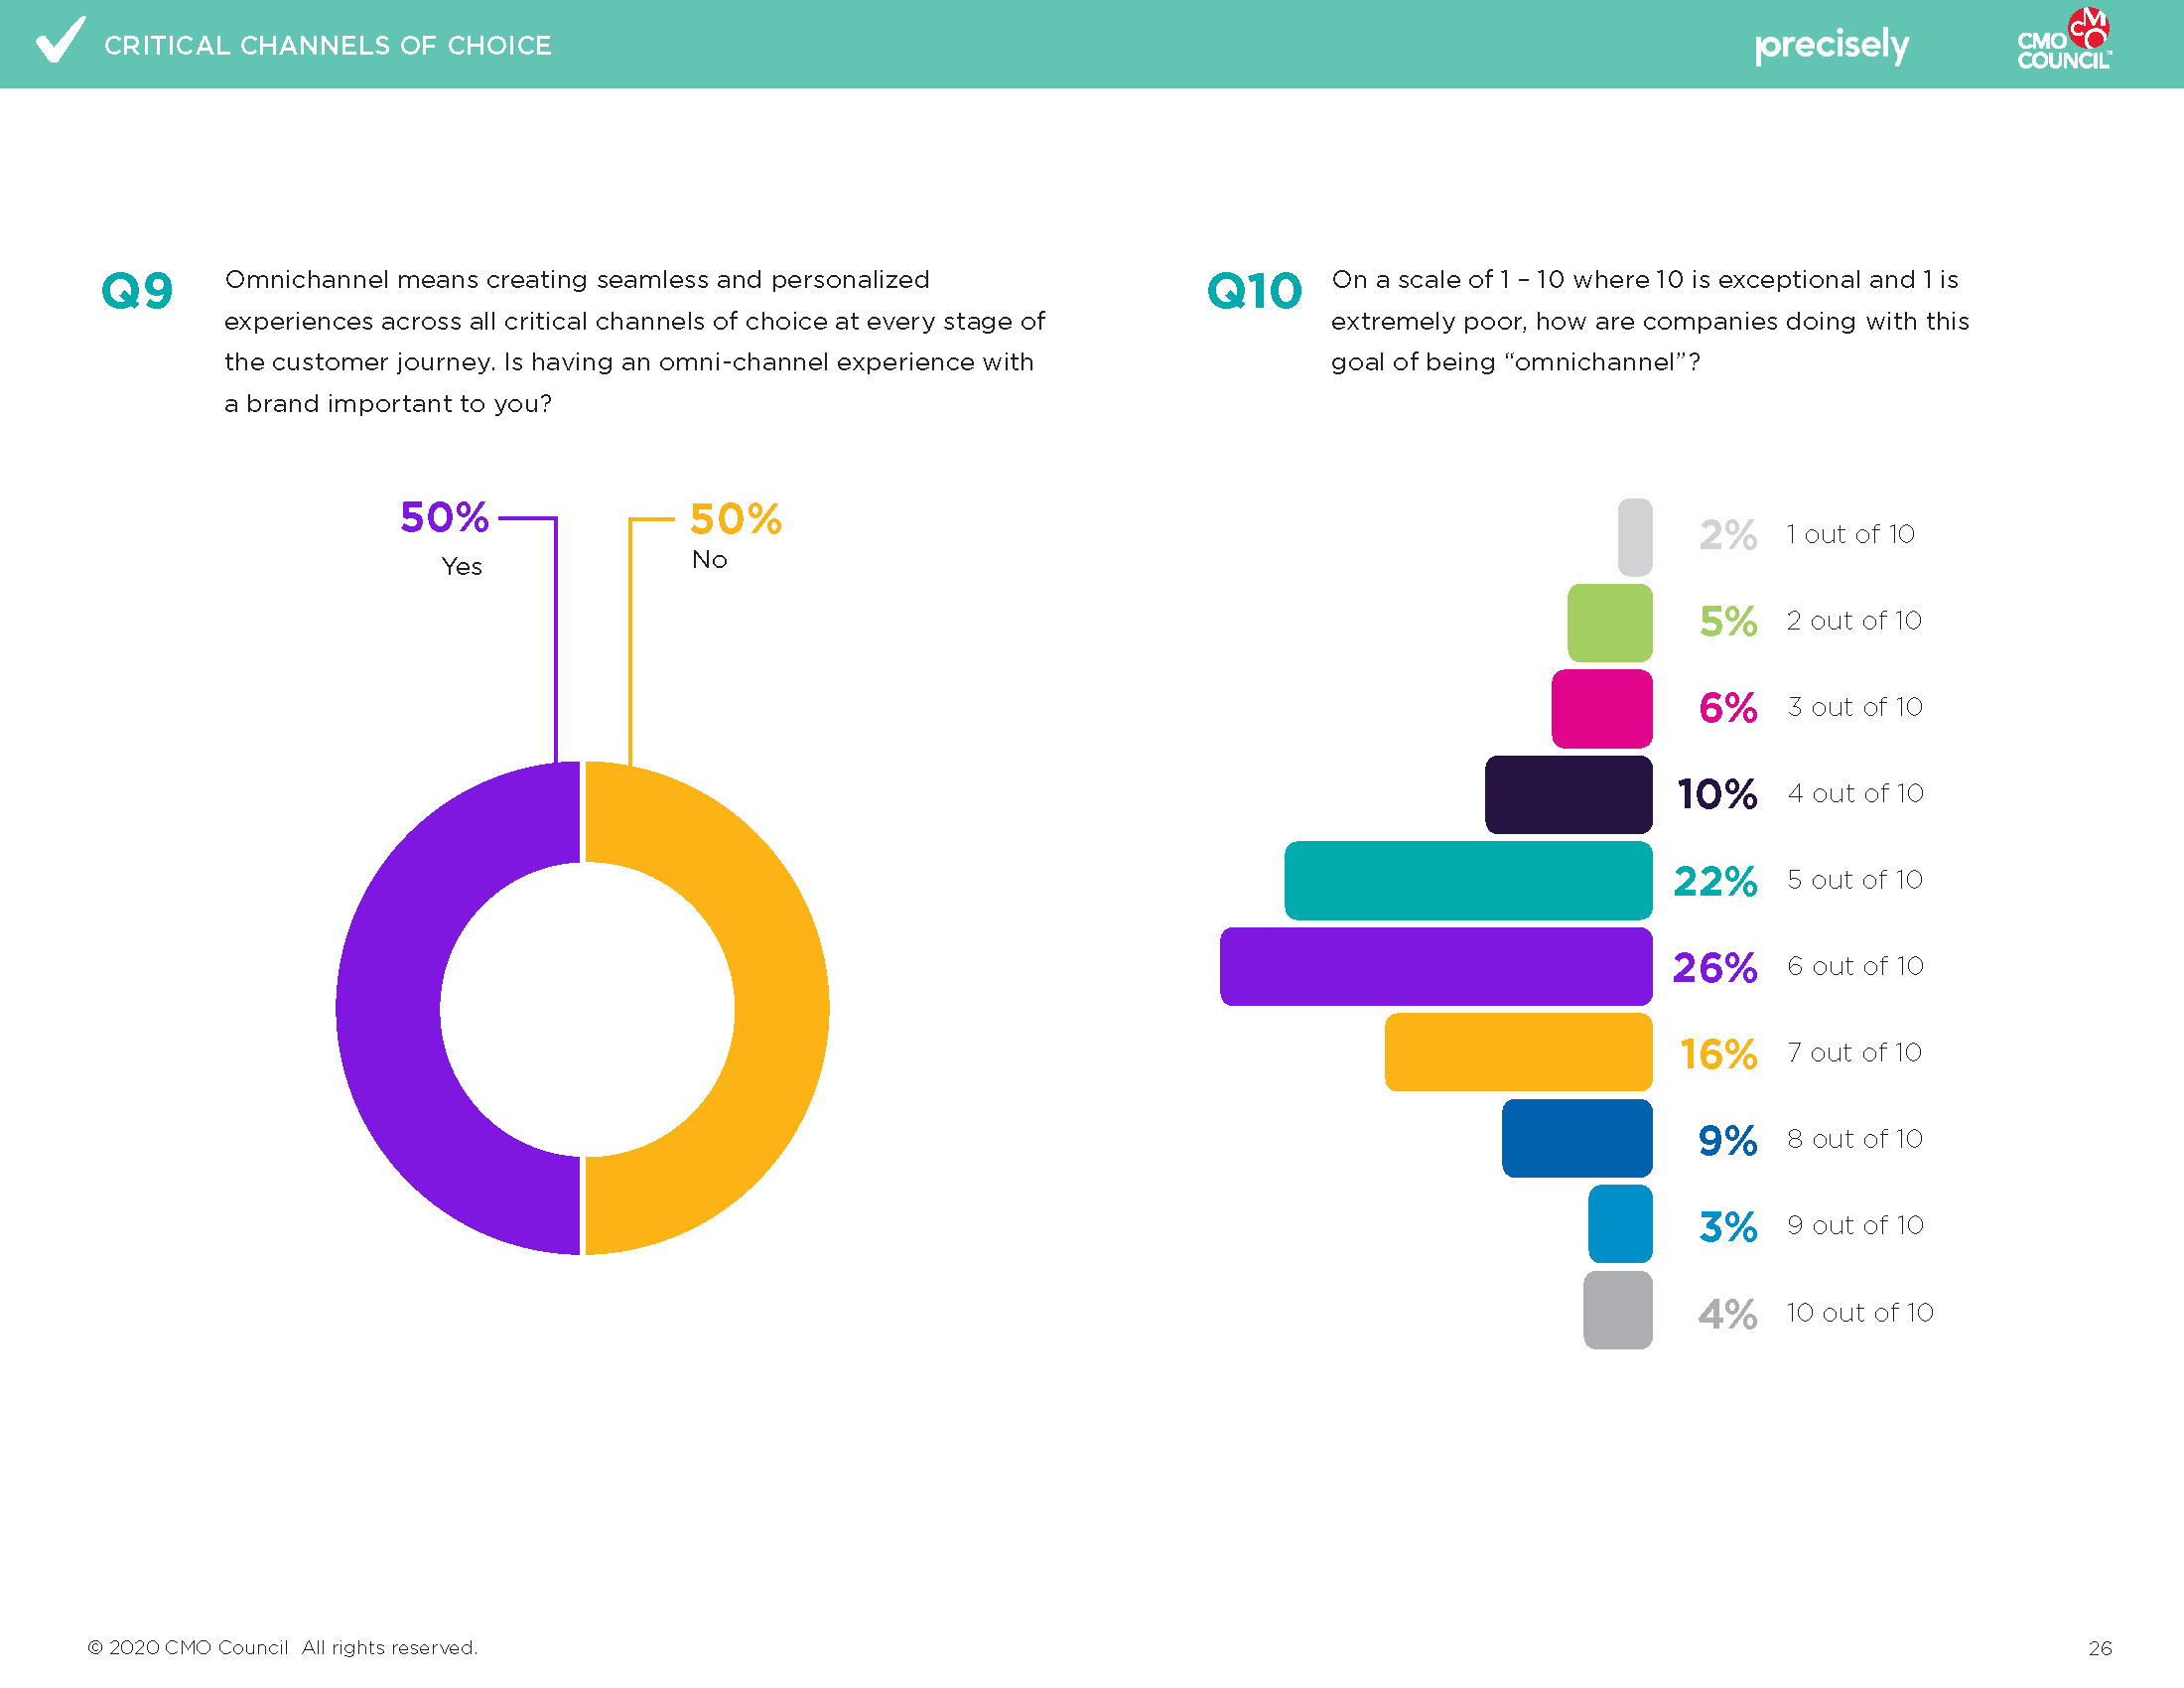
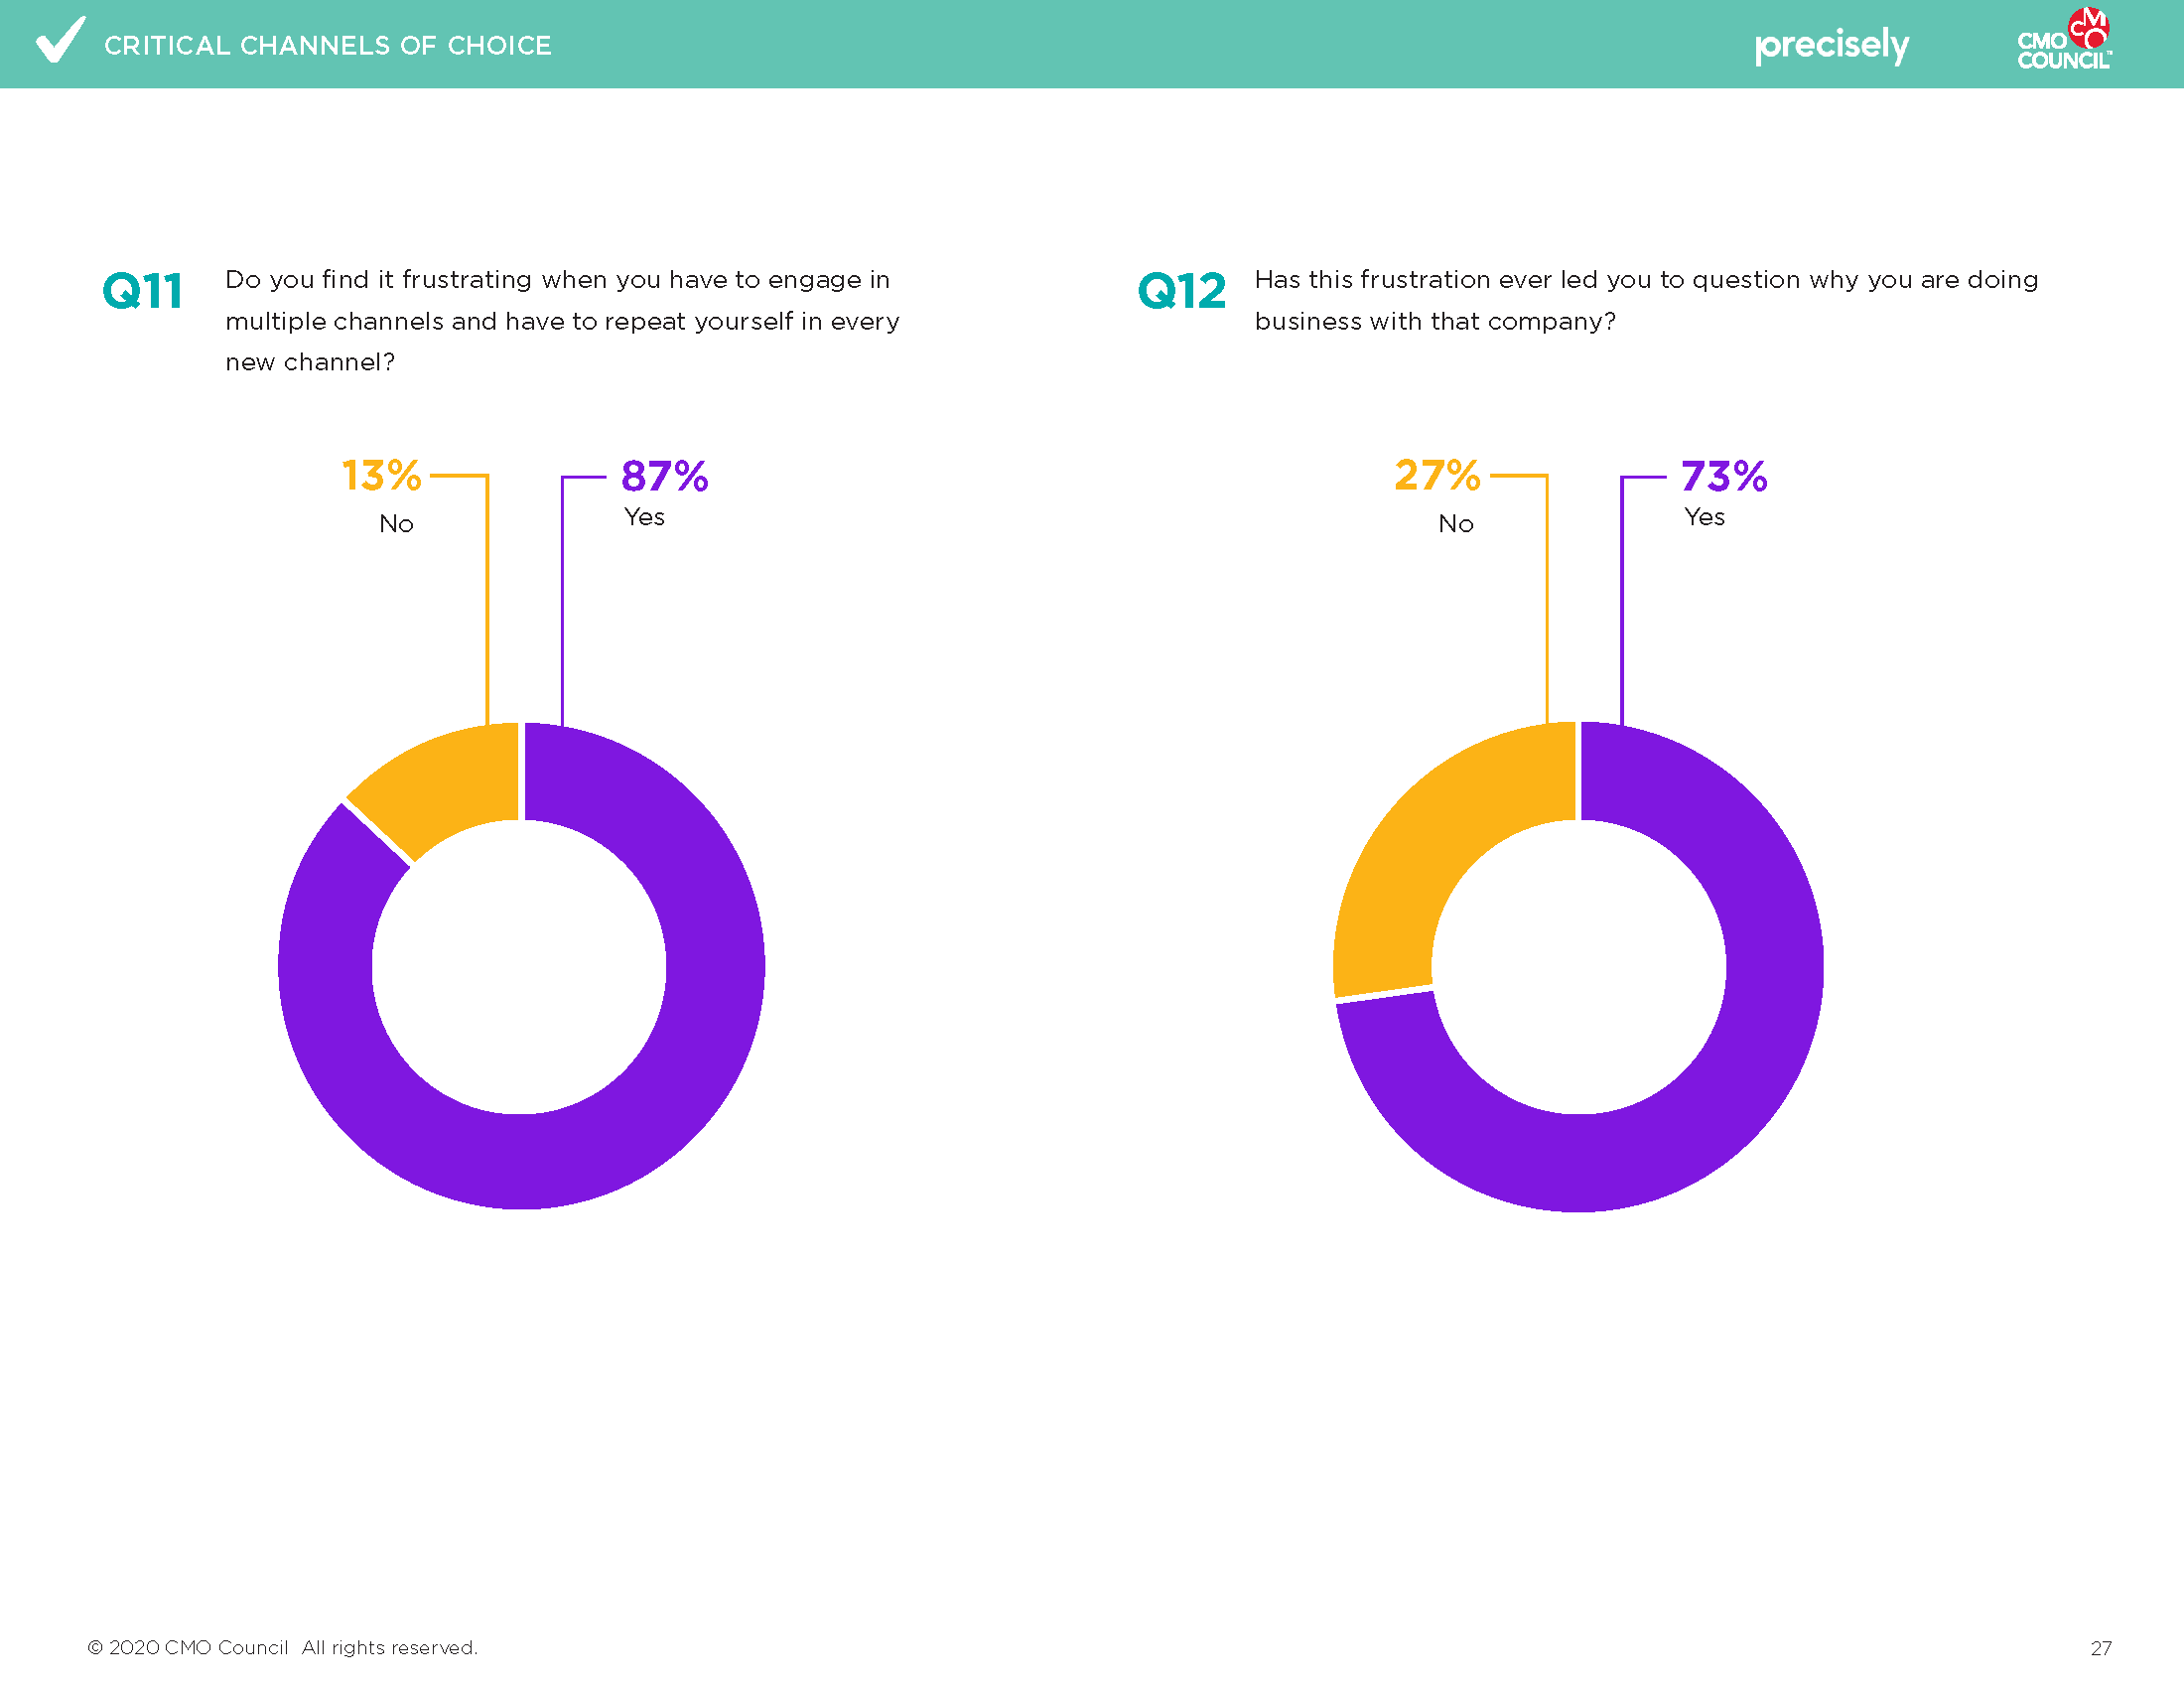
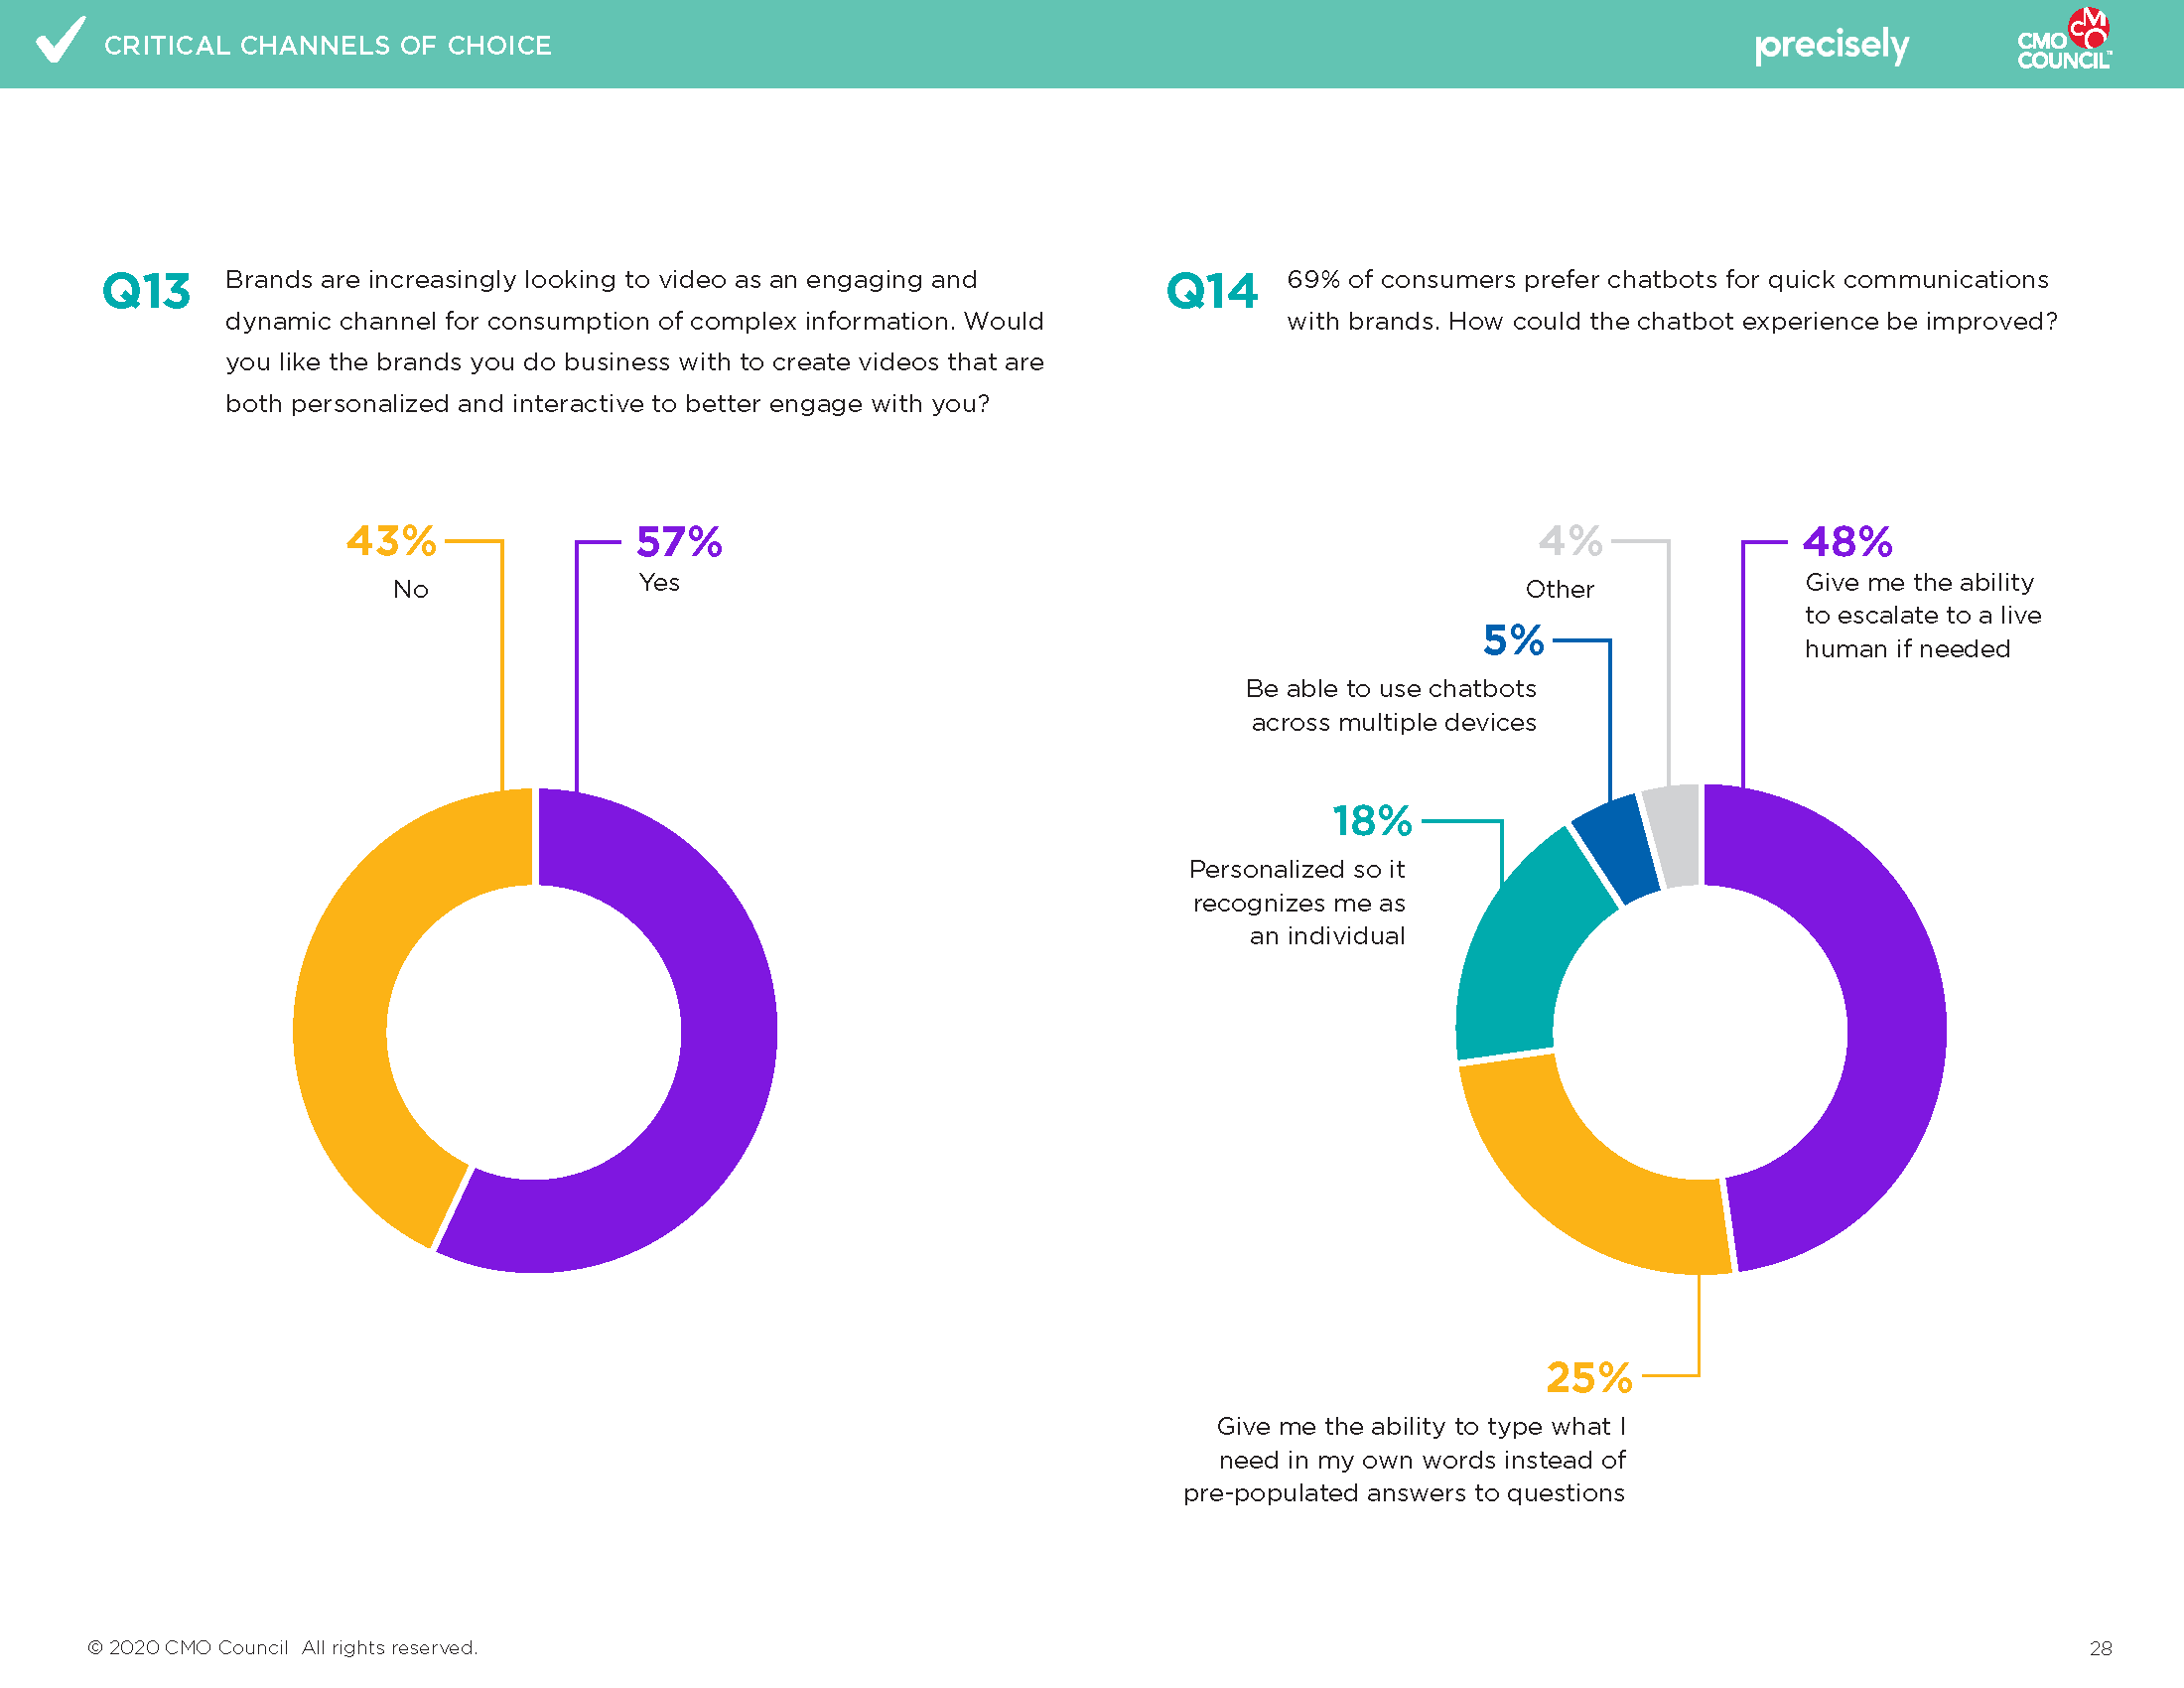
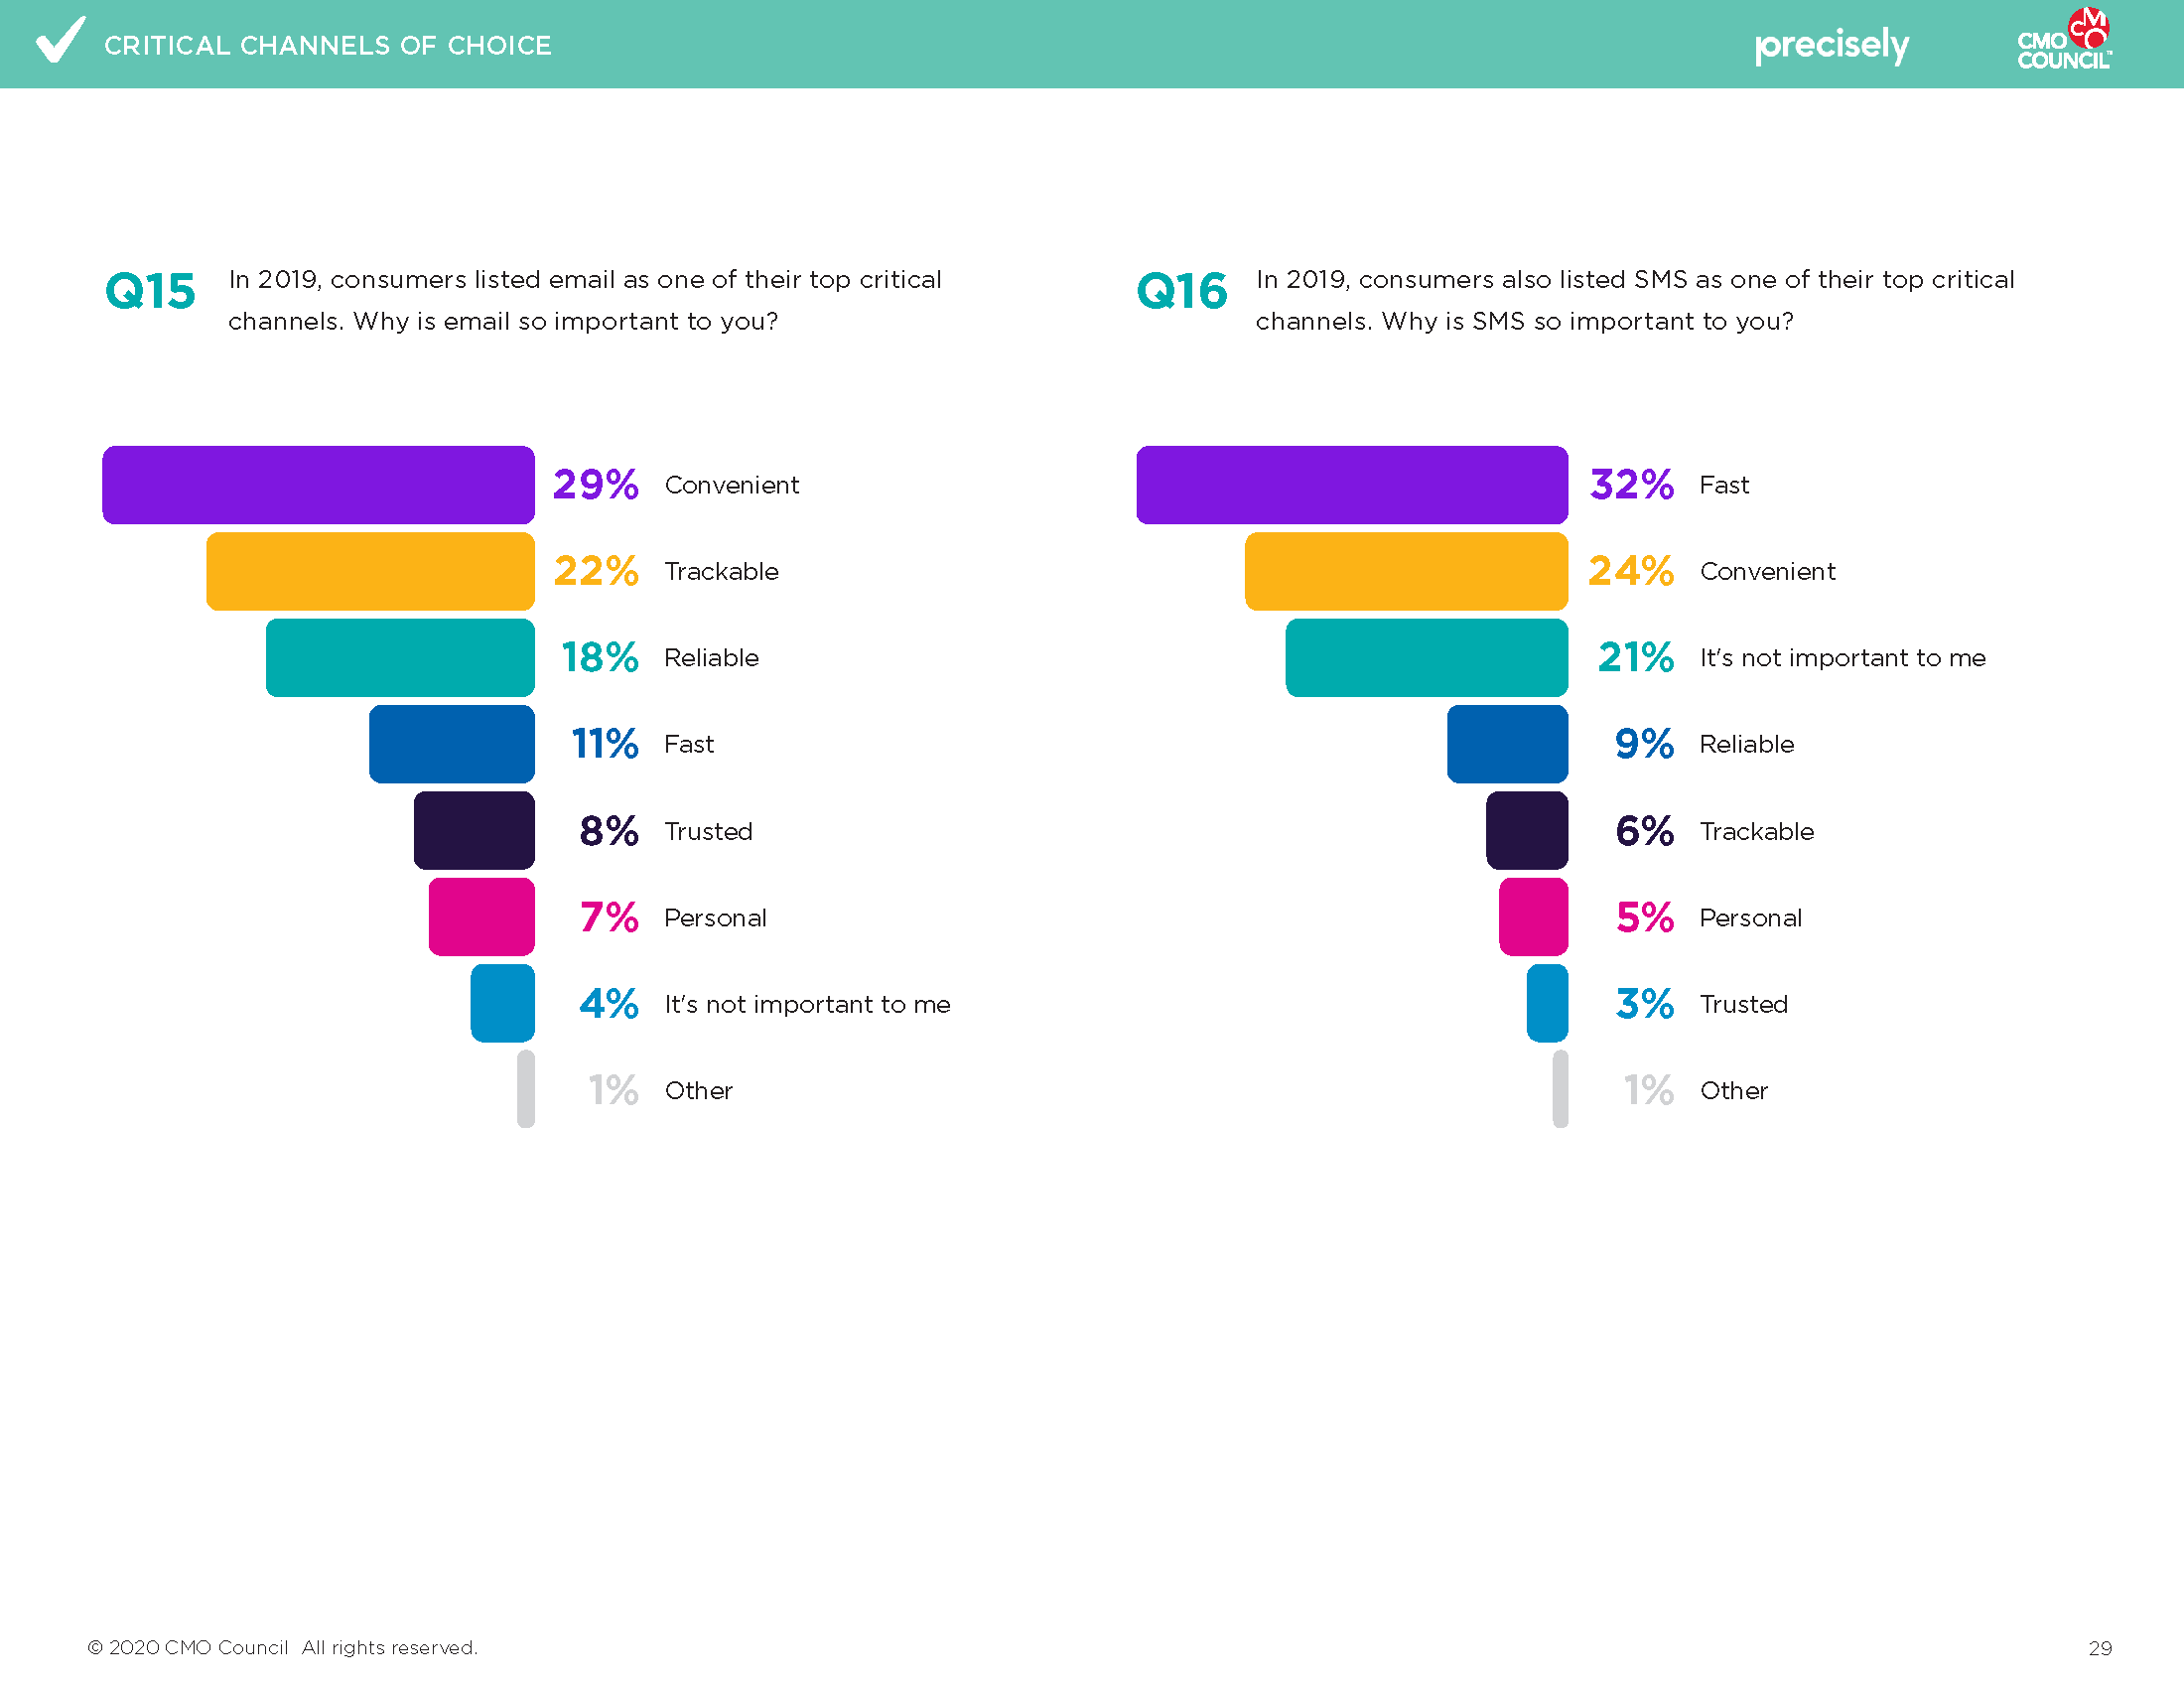
Data Visualization & Infographic Design
I designed charts and graphs to translate complex data into clear, digestible visuals, then extended that work into an accompanying infographic that distilled the key findings into a concise, high-impact format. Throughout, I maintained consistency between the report visuals and infographic elements to ensure a cohesive experience across both deliverables.
Webinar: Customers Expect Omnichannel — So Why Are So Many Brands Missing Them?
This webinar project supported the launch of the CMO Council's Critical Channels of Choice research, conducted in partnership with Pitney Bowes. The campaign highlighted a striking gap in consumer expectations — while the vast majority of global consumers prefer a blend of digital and physical brand experiences, very few feel that brands are actually delivering on that promise. The one-hour interactive webcast brought together industry experts to unpack the research findings and explore what they mean for marketers looking to build more personalized, relevant, and impactful engagement strategies across channels.
Phase 2: Expanding the Precisely Campaign
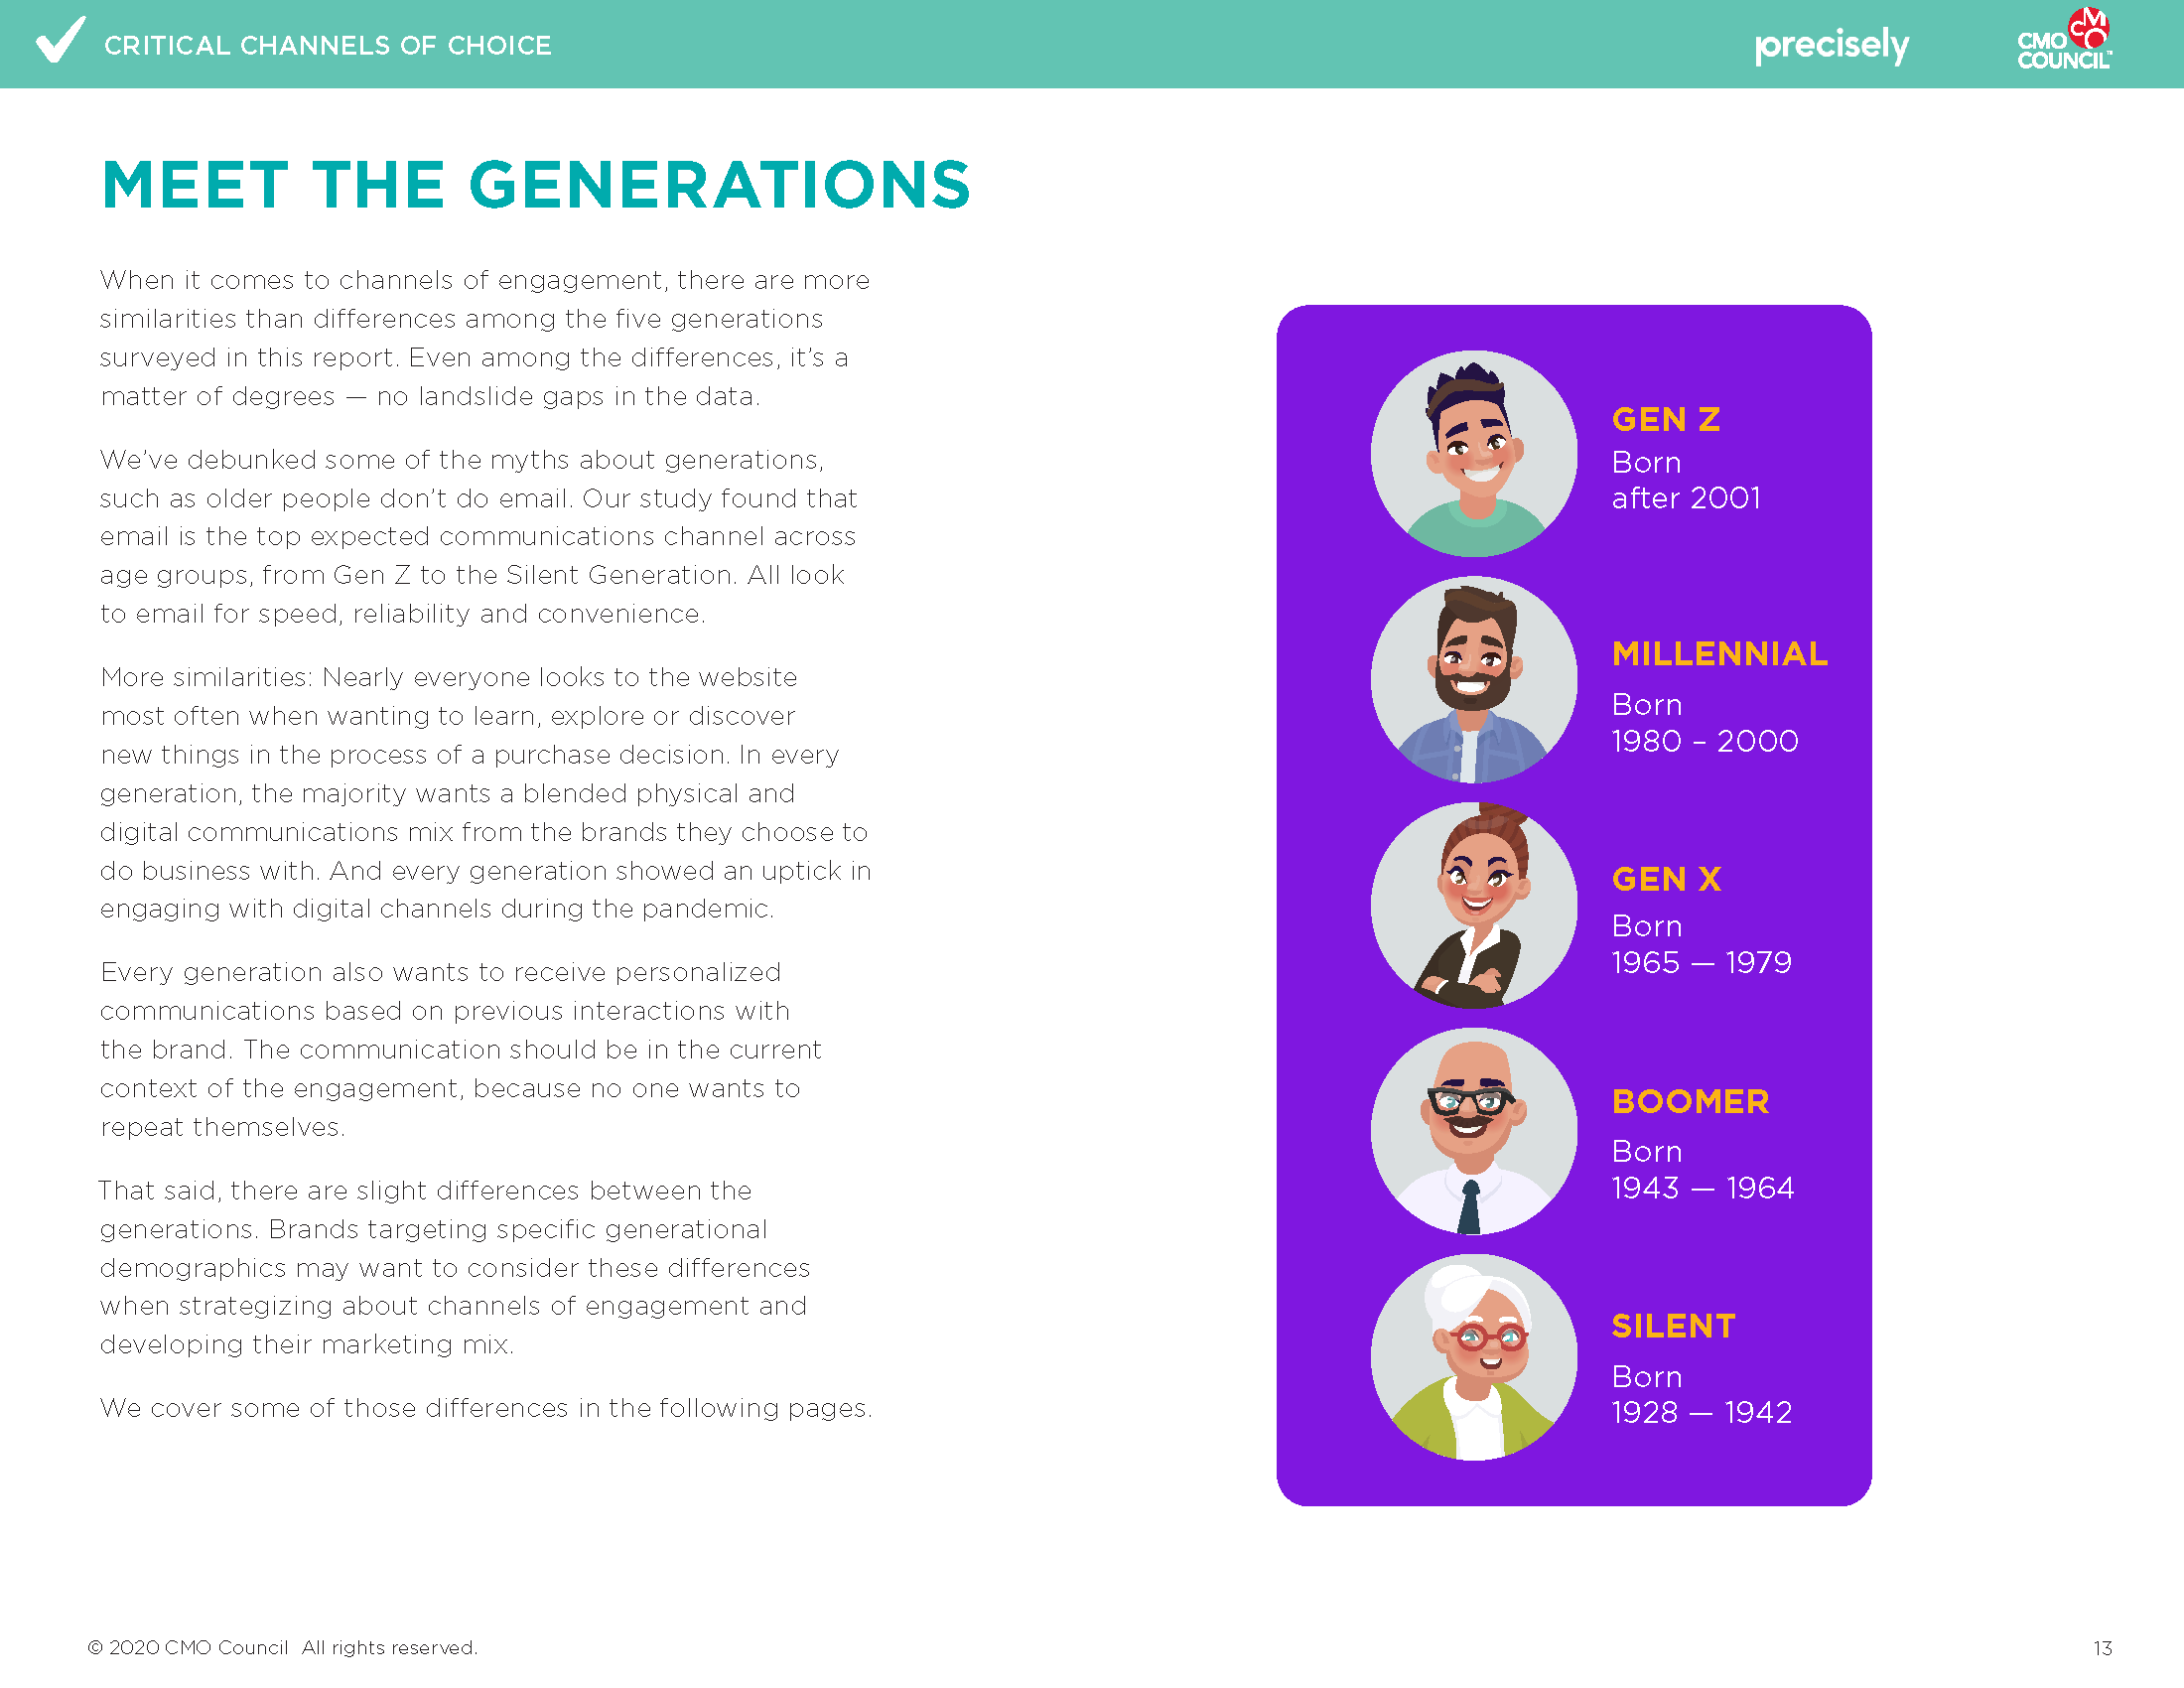
Building on the first phase, the second report expanded the campaign with updated insights, new formats, and more deliverables. I've included a partial version below (a few pages removed to avoid repetition) to show how I carried the visual language forward from Phase 1 while refreshing the color scheme, imagery, and illustrations.
Creating a Connected Experience
●
Creating a Connected Experience ●
Translating Insights Across Formats
Adapted key findings from the report into a condensed infographic designed for quick consumption and broader distribution, developed a webinar presentation that expanded on those insights through a narrative-driven format, and created social assets that distilled major findings into concise visuals optimized for engagement and traffic generation.
Creating a Connected Campaign Experience
Ensured the report, infographic, webinar, and social assets functioned as a connected campaign ecosystem, maintaining a cohesive visual system across all deliverables while adapting layouts and content for each platform and format, and applying consistent branding, typography, and data visualization styles to unify the experience across every touchpoint.
Campaign Assets
Created adaptable assets for webinars and regional campaigns, including social assets that highlighted key findings, while supporting multi-channel marketing initiatives.
Impact
The campaign generated over 1,750 leads through report and webinar engagement, contributing to one of the highest-performing campaigns in the client's history, with scalable design systems enabling the successful extension of a multi-phase initiative.